The site has been live for two years. Nothing looks broken. The contact form produces fewer leads than it did last spring, and nobody can point at a change that would explain it, because nobody made one.
That’s the shape of the problem. A website isn’t a project that ends; it’s a system that decays, and the decay is close to invisible from the inside. You visit your own site from a warm cache, on office wifi, already knowing where everything is. Your buyer arrives cold, on a phone, on a train.
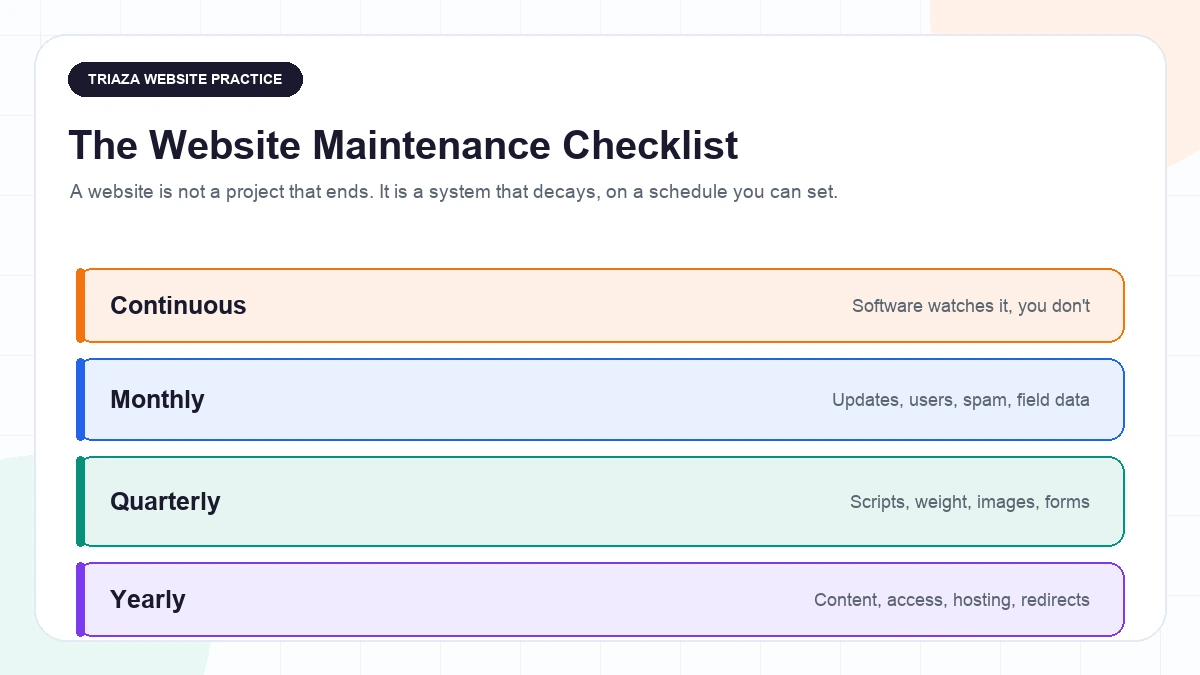
Website maintenance is a recurring schedule, not a project. Set uptime monitoring, automated certificate renewal, backups, malware scanning, and a form check to run without you. Monthly, apply updates and pull real-user performance data. Quarterly, audit third-party scripts, images, and forms. Yearly, review content, accessibility, hosting, and your redirect map.
The rest of this article is that schedule, plus the reasons behind it. Every item has a frequency attached, because “audit your site” with no frequency is exactly why nobody does it.
The Five Minute Refresher, and Where to Start If Your Site Is New
If you’ve never launched this site, you’re in the wrong article. Start with our startup website launch checklist, which covers what has to be true before you point the domain. This one assumes the site is already live and the question is what you do to it from here.
Two things worth having straight before the schedule makes sense. First, Core Web Vitals are judged on real visits, not on a test you run yourself. Google’s guidance is that a good threshold to measure is the 75th percentile of page loads, segmented across mobile and desktop devices: three quarters of real sessions have to clear the bar, and phones are scored separately from laptops. A single run from your desk tells you almost nothing about that.
Second, Interaction to Next Paint has been the stable responsiveness metric for over a year now, having replaced First Input Delay. The bar is that at least 75% of INP experiences should respond to user input in under 200 milliseconds to be considered good. Google’s advice on that page is to check field data first, then reproduce the problem locally, because field data should guide your priorities rather than a lab tool alone. That ordering is why half this checklist is “look at what real visitors experienced” rather than “run a scan”.
What Actually Decays
Nobody adds weight to a website on purpose. It arrives one reasonable decision at a time.
Pages Get Heavier Without Anyone Adding a Page
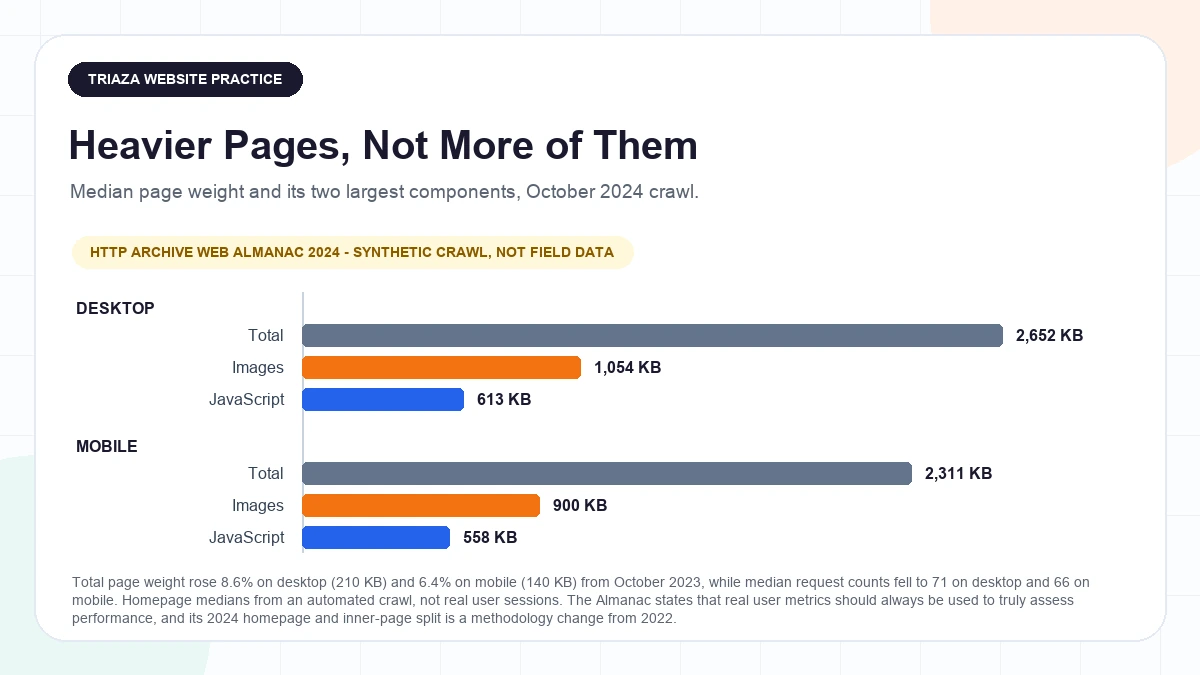
The HTTP Archive’s Web Almanac measured a median total page weight of 2,652 KB on desktop and 2,311 KB on mobile in its October 2024 crawl, up 8.6% on desktop and 6.4% on mobile from a year earlier, which is 210 KB and 140 KB of new weight in twelve months. Within that, JavaScript accounted for a median 613 KB on desktop and 558 KB on mobile, and images for 1,054 KB and 900 KB. Read those as lab numbers, not a description of your visitors. They come from an automated crawl of homepages rather than real user sessions, and the chapter treats homepages and inner pages as separate populations because the two vary strongly. That split is itself a methodology change from the 2022 edition, so the trend line isn’t perfectly like for like, and the report says plainly that real user metrics should always be used to truly assess performance.
There’s an honest wrinkle in the same data worth knowing, because it changes what you go looking for. The median page made 71 requests on desktop and 66 on mobile, down from 76 and 70 in the 2022 edition, on the same synthetic crawl basis. Pages aren’t loading more things. The things they load got bigger.
Third-Party Scripts Accumulate and Nobody Owns Them
Every tag was somebody’s good idea. The chat widget was sales. The heatmap was a designer who has since left. The consent banner was legal. Nobody removed any of them, because removing a script requires knowing what it does.
The Almanac found that more than nine in ten pages load at least one third party, with a median of 66 distinct third parties on the top 1,000 sites against 27 across the top million. Setting aside a large unranked “unknown” bucket, consent management, video, and customer success tools led the named categories by how many pages they appeared on, which is not the same as ranking them by traffic or business impact. Treat those counts as a floor rather than a census: a third party was only counted if its domain showed up on at least 50 unique pages, third parties hidden behind a CNAME on your own domain get counted as first parties, hosting platforms are excluded from the tally entirely, and the chapter says outright that its results present a lower bound on third-party prevalence.
The interactivity cost lands on phones. In the same crawl, 74% of mobile sites had a good INP score against 97% of desktop sites, and pages loading user-behavior analytics scripts had good INP on only 37% of mobile pages, against 53% for consent management providers and 50% for CDN and hosting scripts. The caveats on that breakdown are substantial. The chapter is clear that its own crawl data is only lab data from a single page load, so those figures instead come from the Chrome User Experience Report blended with real user monitoring from RUMvision, which covers fewer sites and can shift results. It’s an association, not a controlled test, so it doesn’t establish that any category of script causes the gap. And the chapter calls the CDN result controversial on its face, since CDNs are normally a performance recommendation, explaining that the CDNs in that category usually deliver first or third-party JavaScript, so the effect belongs to the JavaScript rather than the CDN.
The maintenance version of this is duller than an optimization sprint and works better: list every tag, write a name next to each one, and delete anything nobody will claim.
Images Drift Out of Spec
Images are usually the largest thing on the page and the easiest to get subtly wrong over time. On mobile, 68% of pages have an image as their largest contentful paint element, and 9.5% of the image elements responsible for LCP carry native lazy-loading, which the Almanac calls an anti-pattern that makes pages much slower. Both of those are Almanac estimates rather than exact measurements, in the report’s own terms: its crawlers didn’t load the correct resources, so the numbers derive from the compression densities and aspect ratios of the resources they did load. Lazy-loading the one image the metric is timing tells the browser to wait before fetching the thing you’re being scored on.
Sizing has quietly gotten worse too. The Almanac measured the median sizes attribute at 43% too large on desktop and 16% too large on mobile, pushing the browser to pick a suboptimal image on roughly one in five desktop images and 14% of mobile ones, which it describes as almost twice as bad as two years earlier. Those figures carry the same crawler caveat, since the estimates come from the resources the crawlers did load rather than the correct ones, and the two-year comparison is qualitative rather than a matched control.
Adoption of the lazy-loading attribute itself is rising, from almost a quarter of sites in 2022 to roughly a third, but that’s measured by the attribute being present rather than used correctly, which given the LCP finding is exactly the problem.
One instruction covers most of this: confirm the main image on your most important pages is not lazy-loaded.
Content and Links Rot Underneath You
This one is nobody’s fault and happens to everyone. Pew Research Center sampled just under a million pages from public web archives and found that a quarter of all pages that existed at any point between 2013 and 2023 were no longer reachable by October 2023, with age the strongest predictor: 38% of pages that existed in 2013 were gone a decade later, against 8% of pages from 2023. Pew calls this the most conservative estimate possible, counting a page as gone only when it returned one of nine error codes that definitively indicate the page or host no longer exists, since other codes can’t separate permanent loss from a temporary outage, so the real rate is likely higher.
Your outbound links sit in that same decay. Pew found 23% of roughly 500,000 sampled news pages and 21% of roughly 500,000 sampled government pages had at least one broken outbound link, on the same conservative basis, and that’s the share of pages carrying at least one dead link rather than the share of all links that are dead. A resources page from 2021 and a redirect map nobody revisited after a redesign are where this bites hardest, and both are worth a look when you’re thinking about our SEO work.
The Recurring Checklist
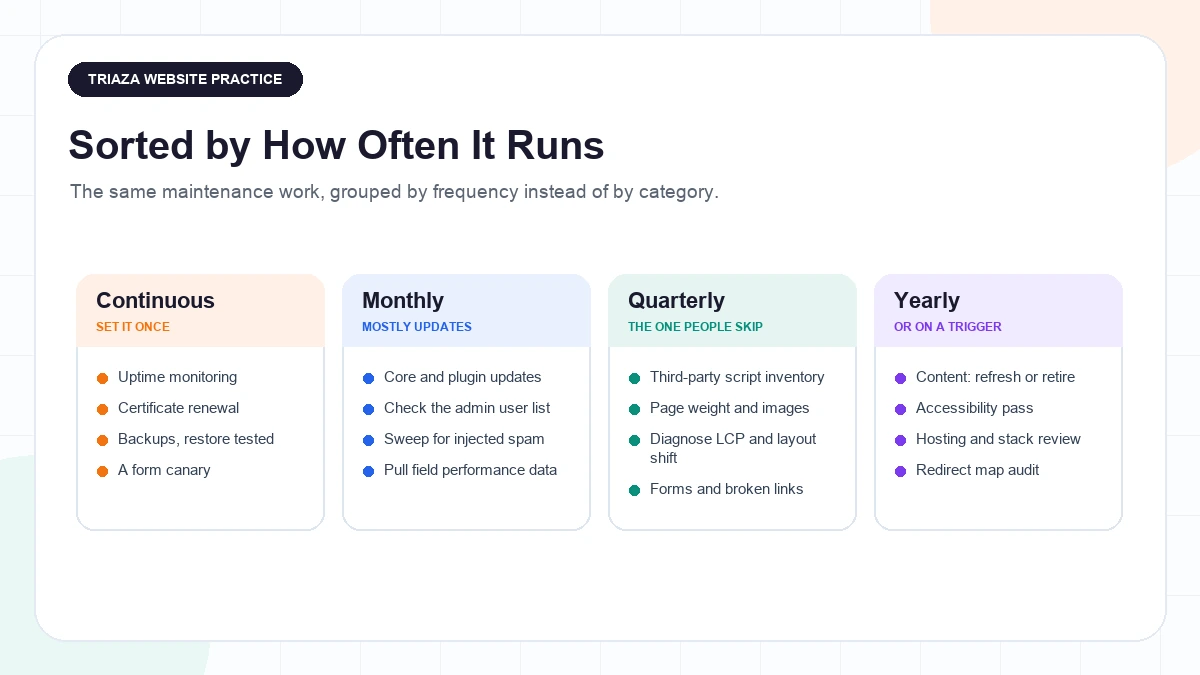
The four tiers below are our own way of triaging this work, not an industry standard. What makes them useful isn’t the grouping, it’s that every item has a frequency, so the schedule can live in a calendar instead of in somebody’s head.
Continuous, Because Software Should Watch This and You Shouldn’t
Five things belong to a machine. Set them once and let them alert you.
- Uptime monitoring on more than the homepage. Point it at your main conversion page too. A homepage that loads while the demo request page throws a 500 is the failure that actually costs you something.
- Certificate renewal, automated and confirmed. Lifetimes have been shortening for years. In an April 2025 post on Certbot 4.0, the Electronic Frontier Foundation describes a shrinking baseline: standard commercial certificate authorities still issue for around a year or more, Let’s Encrypt pioneered a 90-day default years earlier, and Certbot has added support for six-day certificates through an opt-in short-lived profile that renews once about a third of the lifetime remains. That option is opt-in and not yet fully rolled out, and EFF is describing a roadmap rather than measuring what most sites run, so the takeaway isn’t to chase six-day certificates. It’s that manual renewal stopped being viable a long time ago, and “I assume it’s automated” is worth converting into “I checked.”
- Off-site backups, with a restore you have actually tested. An untested backup is a belief. Restore one to a staging copy at least once so you know the process works and roughly how long it takes.
- Malware and file integrity scanning. Compromises tend to surface as injected spam or an admin account nobody created, which is what the monthly checks below are built to catch.
- A form canary. Submit your own contact form on a schedule and confirm the lead lands where it should. That’s our own practice rather than anything measured, and it catches a failure nothing else here will: a form that returns a cheerful success message and delivers nothing.
Most of this is what a website maintenance arrangement consists of, and none of it is interesting. That’s the point. It should run whether or not anyone is thinking about it.
Monthly, and It’s Mostly Updates
Short, and the same week every month so it doesn’t drift.
- Apply core, plugin, and theme updates. The case for doing this on a schedule is unusually well documented. Sucuri’s remediation team reported 39.1% of CMS applications were out of date at the point of infection, and 13.97% of the sites they cleaned still had a vulnerable plugin or theme in place at remediation; that’s their own caseload of sites they were hired to clean, not a random sample of the web, and a CMS counted as outdated only if it was missing the newest security update at cleanup. On the supply side, SecurityWeek reported nearly 8,000 new vulnerabilities disclosed across the WordPress ecosystem in 2024, with plugins responsible for 96% of them against 7 in core, about 43% exploitable without any login, from Patchstack’s own database and risk categorization rather than a neutral industry census.
- Look at your user list. Sucuri found 49.21% of the sites it remediated had at least one backdoor, and 55.2% of infected databases contained a malicious or unauthorized WordPress admin user, again its own remediation caseload rather than a survey of all sites. An admin account you don’t recognize is the highest-signal thing on this list.
- Sweep for injected spam. In the same caseload, Sucuri detected SEO spam on 42.22% of the sites it classified as infected, and on 20.30% of all the sites it remediated. Those percentages use different denominators, infected sites versus every site cleaned, so they aren’t two views of one number and neither describes the web as a whole.
- Pull field data on Core Web Vitals. Not a lab score. What real visitors experienced last month, split by mobile and desktop. If you have no measurement installed, that’s the first job, and our rundown of SEO tools for small businesses covers the free ones that get you there.
- Confirm analytics and conversion tracking still fire. Tracking breaks silently during redesigns and plugin updates, and you find out when you need a number you don’t have.
Quarterly, and This Is the One People Skip
The longest of the four tiers, and the one that gets postponed.
- Inventory your third-party scripts and delete the orphans, per the section above.
- Check page weight against what it was last quarter. The direction matters more than the absolute number.
- Diagnose LCP before you touch image compression. Most sites get this backwards. Google’s analysis of field data found the median origin with good LCP still spends about 600 milliseconds in server response time at the 75th percentile, while the median origin with poor LCP spends 2,270 milliseconds there and then waits another 1,290 milliseconds before the main image even starts downloading, almost four times as long as the download itself. The majority of poor-LCP origins spend less than 10% of their LCP time actually downloading the image. Those are medians of the 75th-percentile value across origins rather than a floor every site clears, and Google notes the field data includes visits where the image was already cached, which pulls the numbers down, though taking the 75th percentile per origin filters much of that out. So check your server response time and what’s blocking the image request before you re-export the image at lower quality. Compressing a file that isn’t the bottleneck is a satisfying afternoon that changes nothing.
- Check layout shift on your real templates, not just the homepage. Worth knowing why an old report isn’t comparable to a new one: the Chrome team changed how CLS is calculated in April 2021, moving from a sum across the whole page lifespan to the worst burst of shifts within a session window, capped at five seconds. Testing across millions of pages, they found 55% of origins saw no change at the 75th percentile, around 3% moved up into good, and no page scored worse. A CLS figure from an audit predating that change isn’t measuring the same thing as one from today.
- Audit your images for the two failures above: a lazy-loaded main image, and sizing that no longer matches the layout.
- Sweep for broken links, internal and outbound.
- Count your form fields. Baymard Institute measured the average e-commerce checkout at 11.3 form fields in 2024, down from 11.8 in 2021 and 12.7 in 2019, against roughly 8 that are actually needed, from its benchmark of 335 top e-commerce sites and over 200,000 hours of its own UX research. That was measured on retail checkout, not B2B lead forms, so the number doesn’t transfer to your demo request form even though the direction does. If your form has grown since launch, you’re moving against a five-year trend.
- Check the site on a phone, deliberately, as a task. The dedicated tooling went away: Google retired the Mobile Usability report in Search Console, the Mobile-Friendly Test tool, and its API on December 1, 2023, after nearly ten years, folding the evaluation into Lighthouse. Google was explicit that this doesn’t mean mobile usability stopped mattering, saying it remains critical for users and stays part of its page experience guidance. Don’t hunt for a report that no longer exists, and don’t read its absence as permission to stop checking.
Yearly, or Whenever the Site Structure Changes
- Review your content and decide: refresh or retire. Refresh means changing the content. It does not mean changing the date. Google’s John Mueller has said the company “definitely wouldn’t rank those pages differently in search just because you’re changing the date and time on a page”. His guidance was that dates should be updated when you make significant changes to a page, not for minor tweaks, and that changing a date without a meaningful content update can mislead readers. He also noted that automatic date stamps a CMS generates outside your control aren’t a problem, so you don’t need to fight your own platform over this.
- Run an accessibility pass. One line here because it’s covered in the launch checklist, and because it’s a real project rather than a checklist item.
- Review hosting, platform, and stack. Not to migrate. To notice that you’re two major versions behind and to plan for it before it’s urgent.
- Audit your redirect map after any structural change, and again once a year regardless. Old links keep pointing at old URLs long after you’ve forgotten those URLs existed.
How an Unattended Site Quietly Stops Capturing Leads
This is the section every article about website maintenance fills with invented numbers, so it’s worth saying what we found: nothing. There’s no published study connecting any of the mechanisms below to a specific percentage of lost leads. What’s out there is a circuit of listicles quoting each other with no named study, no date, and no methodology. So the following are mechanisms, not measured outcomes, and if somebody quotes you a conversion cost for any of them, ask them for the study.
The mechanisms are real enough on their own:
- The form is on a phone, and phones are where responsiveness lags. The Almanac found 74% of mobile sites had a good INP score against 97% of desktop sites, a figure blending Chrome User Experience Report field data with third-party monitoring rather than a controlled test, and that gap sits on the same devices your buyers fill in forms on.
- A compromised site serves content you didn’t write. Injected spam and admin accounts you never created mean visitors and search engines see something other than your pages.
- An expired certificate puts a browser warning between a buyer and your site. No study needed for this one; it’s what browsers do.
- Links break as the pages behind them disappear, at the rates Pew measured, and a resources page full of dead ends reads as neglect.
- Forms grow fields that nobody removed, one internal request at a time.
None of these announce themselves. That’s the entire argument for a schedule.
What Performance Work Is Actually Worth
Speed work does pay off, sometimes substantially. It is not a lever with a fixed exchange rate, and anyone who quotes you one is selling something.
The wins are real. Rakuten 24 ran a month-long test splitting traffic evenly between a Core Web Vitals optimized landing page and the untouched original, and reported a 33.13% increase in conversion rate and a 53.37% increase in revenue per visitor. That’s a genuine 50/50 split with the versions otherwise identical, but it’s one company and one landing page, picked because it had enough traffic to reach significance, over one month, with only relative percentages published and no absolute baseline or sample size, and web.dev frames it as part of a journey rather than a destination.
Mail.ru reported more than 10% conversion increases across its core sections after months of work moved its 75th-percentile CLS from needs-improvement to good, lifting the share of good CLS from 33% to 93%. That wasn’t a controlled test at all but a before-and-after comparison of two specific weeks in 2021, and the case study notes the search section fell 6.7% over the same window for unrelated rendering reasons, with May holidays causing their own dips.
redBus reported a 7% overall increase in sales after cutting search-page INP by 72%, from the 870 to 900 millisecond range down to 350 to 370, mostly by fetching fewer results per lazy-load call and reducing re-renders. Again a single company, field measurements rather than an experiment, sequential engineering changes rather than a controlled comparison, and no absolute sales baseline.
Now the other side, which deserves equal volume. Portent analyzed seven mid-size sites averaging 764,000 monthly sessions and $4.6 million in monthly revenue, from May 2019 to September 2023, and found almost no correlation between First Input Delay and business outcomes: -0.139 against sessions, 0.171 against revenue, 0.015 against goal completions. Their own framing is that Core Web Vitals are subtle enhancers rather than definitive drivers, and they’re clear it’s seven sites, correlational rather than experimental, and that changes this slow are hard to isolate from everything else moving across a multi-year window.
The most useful caveat comes from someone with every incentive to say the opposite. Writing in the Web Performance Calendar, the head of marketing at the performance vendor Fasterize reports that 90% of her company’s A/B tests showed positive conversion impact, averaging 8% uplift with a median of 4%, while stating she could not demonstrate a strong correlation between improving any single metric, such as server response time, and increased conversions. That’s a vendor reporting its own book of business, so read the 90% accordingly. She also notes results vary with audience, product type, and market competitiveness, that abandonment on a slow page might owe as much to site ergonomics, competition, or content quality as to speed, and that a test needs one to two months before you believe it.
Together those land somewhere narrower than either camp’s marketing: a bundle of performance work, tested on your own traffic over a month or two, is the only thing that answers what it’s worth to you. Which is a schedule, not a project.
What to Skip
- Chasing a 100 Lighthouse score. It’s a lab tool on a simulated device. Useful for finding problems, misleading as a target, and your visitors are not a simulated device.
- Converting every image to a new format at once. Do the ones on pages that matter, confirm nothing broke, move on.
- Re-dating old posts. Covered above. Change the content or leave the date alone.
- Applying updates the same day they drop on a site with no staging copy and no tested backup. Fix the staging and backup problem first, then the update cadence takes care of itself.
- Buying a monitoring tool before anyone has agreed to read the alerts. An unread alert is worse than no alert, because it feels like coverage.
The Schedule, in One Place
Continuously: uptime, certificate renewal, backups with a tested restore, malware scanning, and a form canary. Monthly: updates, user list, spam sweep, field performance data, and a check that tracking still fires. Quarterly: third-party scripts, page weight, LCP diagnosis, layout shift, images, broken links, form fields, and the site on a phone. Yearly: content, accessibility, hosting, and the redirect map.
Put it in a calendar with a name attached to each tier. The version that works is a short recurring review that actually happens, not an annual audit that keeps getting moved.
If you’d rather it was someone else’s standing job, that’s the shape of our website maintenance work.
Questions Owners Ask About Website Maintenance
How often should I update my website? Split it by type of work. Uptime monitoring, certificate renewal, backups, and malware scanning should run continuously without you. Software updates are monthly at minimum: SecurityWeek reported nearly 8,000 new vulnerabilities disclosed across the WordPress ecosystem in 2024, 96% of them in plugins, from Patchstack’s own vendor database rather than an independent census. Performance and content audits are quarterly. Hosting, accessibility, and redirect maps are yearly.
Will a faster site rank higher, or convert better? Not reliably, and not as a switch. Portent’s analysis of seven mid-size sites from May 2019 to September 2023 found correlations between First Input Delay and business outcomes of -0.139 for sessions, 0.171 for revenue, and 0.015 for goal completions, framing Core Web Vitals as subtle enhancers rather than definitive drivers; that’s seven sites and correlational, not an experiment. A performance vendor’s own head of marketing reports 90% of Fasterize’s A/B tests showed positive conversion impact, averaging 8%, while stating she could not show a strong correlation between improving any single metric and conversions, and that’s a vendor reporting its own tests. Do the work for the visitor, test bundles on your own traffic, and treat any promised exchange rate with suspicion.
How do I know if my Core Web Vitals are actually bad? Look at field data, not a test you ran. The measurement Google recommends is the 75th percentile of page loads, segmented across mobile and desktop, so three quarters of real sessions need to clear the bar and your phone traffic is scored separately from desktop. For responsiveness specifically, at least 75% of interactions should respond in under 200 milliseconds, and Google’s advice on that page is to check field data first and only then reproduce the issue in a lab tool. Small sites sometimes have no field data at all, in which case you’re working from lab tools and your own phone.
Do I really need to update plugins every month? It’s the cheapest item on the list and the best evidenced. Sucuri’s remediation team found 39.1% of CMS applications were outdated at the point of infection, counted as missing the newest security update at cleanup time, from its own caseload of sites it was hired to clean rather than a random sample. SecurityWeek reported that 33% of WordPress vulnerabilities disclosed in 2024 had no patch available when they became public, noting many of those sit in abandoned plugins that will likely never be patched, again from Patchstack’s own tracking. That last part is the real monthly job: not just applying updates, but noticing which of your plugins stopped being maintained.
What happens if I skip a certificate renewal? Visitors get a browser warning instead of your site. The practical answer is to confirm renewal is automated rather than assume it. Lifetimes have been getting shorter for years: EFF’s April 2025 post on Certbot 4.0 describes commercial certificate authorities still baselining around a year or more while Let’s Encrypt has long defaulted to 90 days, and Certbot adding an opt-in six-day profile that renews once about a third of the lifetime remains. That short-lived option is opt-in and not yet fully rolled out, and EFF is describing a roadmap rather than measuring what sites actually run, so the point isn’t the six-day number. It’s that manual renewal is not a strategy.
How do I find broken links on my site? Any crawler will list them; the job is doing it on a schedule rather than picking a tool. It matters because the pages you link to keep disappearing: Pew found a quarter of all pages that existed between 2013 and 2023 were gone by October 2023, on a sample of just under a million pages and using the most conservative counting method available, so the true rate is probably higher. Start with your oldest resources pages and any redirect map left over from a redesign.
Should I update the publish date on old blog posts to keep them fresh? No. Google’s John Mueller has said the company “definitely wouldn’t rank those pages differently in search just because you’re changing the date and time on a page”. His guidance was to update dates when you make significant changes, not for minor tweaks, and he noted that changing a date without a real content update can mislead readers. Automatic CMS date stamps outside your control are fine and don’t need fixing.
Where did the Mobile Usability report in Search Console go? Google retired it, along with the Mobile-Friendly Test tool and its API, on December 1, 2023, after nearly ten years, moving the evaluation into Lighthouse and other tools. Google said explicitly that this doesn’t mean mobile usability stopped mattering, that it remains critical for users, and that it’s still part of its page experience guidance. Use Lighthouse and PageSpeed Insights, and keep checking the site on an actual phone.