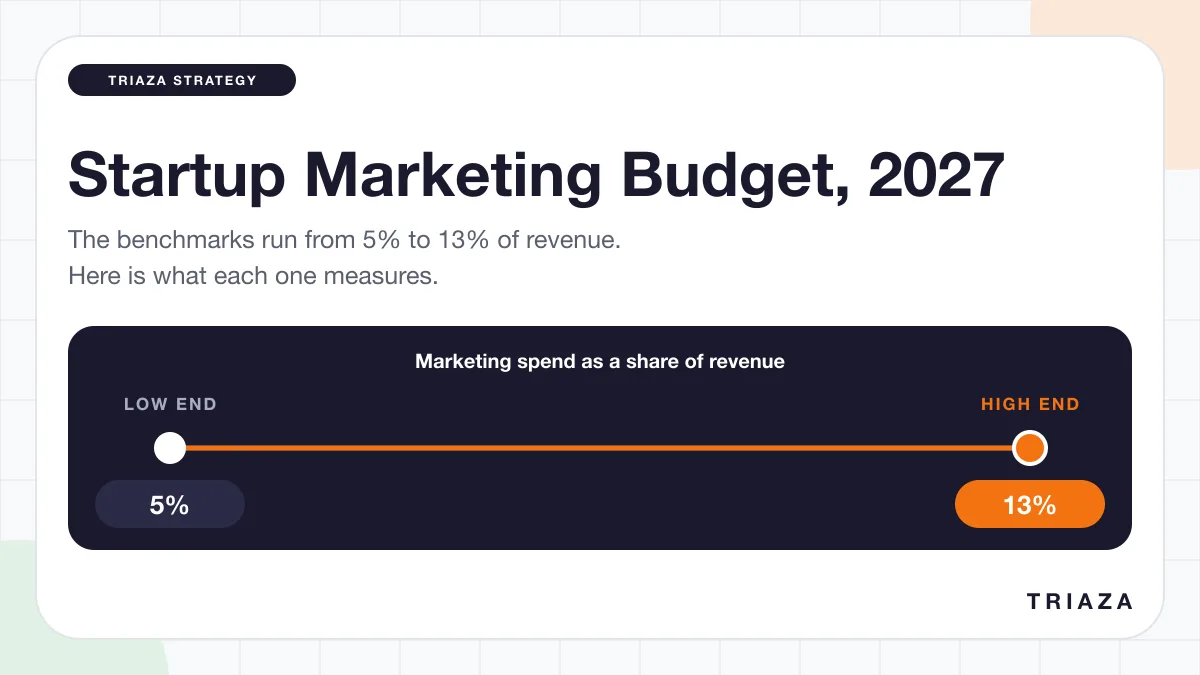
A startup with revenue should expect to spend between 5% and 13% of it on marketing in 2027, going by the benchmarks published this year. A bootstrapped B2B software company sits near 5% of annual recurring revenue (ARR), an equity-backed one near 10%, and the smallest companies in the broadest U.S. survey average about 13%.
That range is too wide to budget from, and the reasons are in the sources. They survey different companies, and some report means while others report medians. Gartner’s 7.8% figure comes mostly from companies with more than $1 billion in revenue. Among B2B technology companies under $5 million, one 2026 dataset has the middle half planning anywhere from 1% to 30%.
So this guide lists each current benchmark with its edition and sample, converts it to dollars, and then builds a budget from the other direction, starting with what a customer is worth. The worked examples use made-up inputs and are labeled as illustrations.
For a B2B software startup, SaaS Capital’s medians run from 5% to 10% of ARR, and Benchmarkit’s median plan is 12% for companies between $5 million and $20 million in revenue. For other small companies, the best available reference is a 13% average with a very wide spread. Either way, test the figure against what you can afford to pay for a customer and what the plan costs at current channel prices. When those disagree with the benchmark, trust them over the benchmark.
The Current Benchmarks, Converted to Dollars
Each row is the most recent edition we could find as of November 11, 2026. The last column is the only calculation: the percentage times $1,000,000, divided by 12. Multiply it by your revenue in millions.
| Benchmark | Who was surveyed | Marketing as a share of revenue | Per $1M of revenue, per month |
|---|---|---|---|
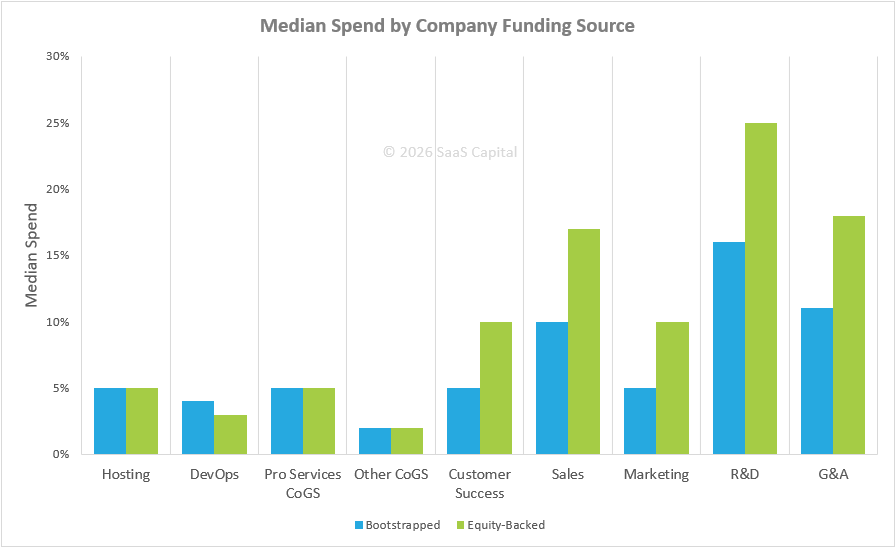
| SaaS Capital 2026, bootstrapped | Private B2B SaaS companies, more than 1,000, survey completed March 2026 | About 5% of ARR (read from a chart) | $4,167 |
| Benchmarkit 2026, under $5M revenue | 173 B2B technology companies surveyed in Q1 2026, 19.1% of them under $5M | Median 6% planned for 2026; 9% actual in 2025 | $5,000 to $7,500 |
| SaaS Capital 2026, all companies | Same survey | Median 8% of ARR | $6,667 |
| SaaS Capital 2026, equity-backed | Same survey | About 10% of ARR (read from the same chart) | $8,333 |
| Benchmarkit 2026, $5M to $20M revenue | Same report | Median 12% planned for 2026 | $10,000 |
| CMO Survey 2026, under $10M sales revenue | 20 respondents at U.S. for-profit companies, all sectors, fielded January 7 to 29, 2026 | Mean 13.34% | $11,117 |
| CMO Survey 2026, $10M to $25M | 15 respondents, same survey | Mean 17.40% | $14,500 |
| Gartner 2026 | 401 marketing leaders, most at companies above $1B in revenue | 7.8% | $6,500 |
The rows differ by more than a factor of three, and the samples explain most of it. SaaS Capital and Benchmarkit report medians for software and technology companies. The CMO Survey reports means across every sector, and 97% of its 308 respondents are VP level or above, so the sample leans toward companies that already employ a senior marketer. The under-$10M figure also rests on 20 answers with a standard deviation of 13.21, almost as large as the mean, and the same band read 17.0% in the 2025 edition.
Under $5 million, the spread tells you more than the middle. Benchmarkit’s smallest companies planned a median 6% for 2026, with the 25th percentile at 1% and the 75th at 30%. Their 2025 actuals ran 3%, 9% and 23%. The report’s own footnote says to read the sub-$5M figures as directional, because plans at that size can include one-time launch costs.
Why the Famous Numbers Do Not Fit a Startup
Gartner’s 2026 CMO Spend Survey, released May 11, 2026, put marketing budgets at 7.8% of company revenue, up from 7.7% in 2025, which Gartner called “effectively flat.” Its 401 respondents were marketing leaders, the vast majority at organizations with more than $1 billion in annual revenue. That measures enterprise budgets well and says little about a company with 15 employees.
The CMO Survey’s 2026 topline gives a mean of 8.96% of revenue across all respondents. The median in the same table is 5%. A few heavy spenders (the maximum is 42.99%) pull the mean up. That figure comes from 154 answers. The survey invited 2,111 marketing leaders and 308 responded, a 14.6% rate.
Then there is the rule that the SBA recommends 7% to 8%. It traces to a June 4, 2012 post on the SBA’s community blog by Caron Beesley, a community moderator. The post said small businesses with revenue under $5 million should allocate 7 to 8 percent of revenue to marketing, and that this assumed margins of 10 to 12 percent after expenses. It cited no data. The paragraph before it said many businesses allocate 2 to 3 percent for run-rate marketing and up to 3 to 5 percent for start-up marketing. An SBA Ascent planning worksheet repeats the rule, margin assumption included. What gets quoted as SBA guidance is a fourteen-year-old rule of thumb.
What Software Companies Spend on Sales and Marketing Together
A marketing budget is half of a decision. The other half is sales, and the split between them depends on how the company sells. Benchmarkit’s 2025 edition found product-led companies carrying larger marketing budgets as a share of revenue, and marketing’s share of the combined budget falling as contract value rises.
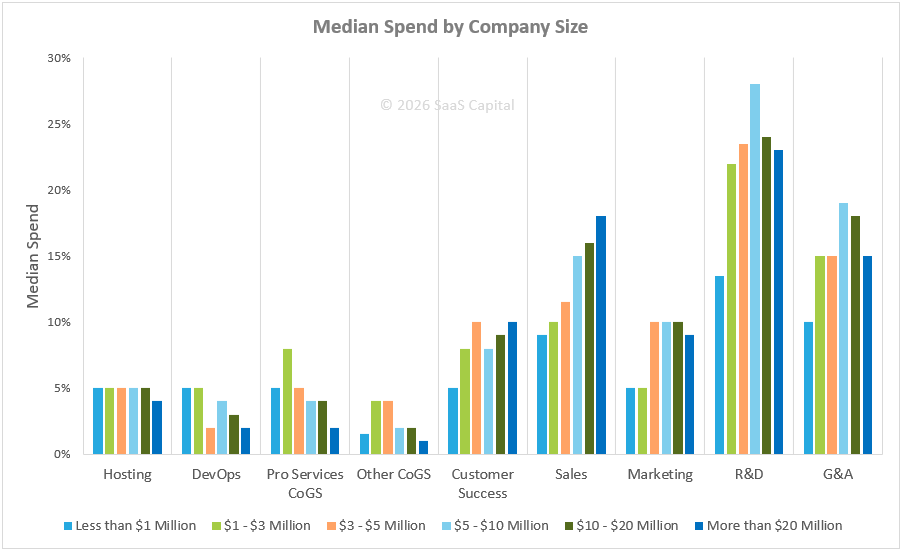
SaaS Capital publishes sales and marketing spend by ARR band as a bar chart without data labels. We read each bar to the nearest half point, added sales to marketing, and divided marketing by the sum.
| ARR band | Sales | Marketing | Sales plus marketing | Marketing’s share of the sum |
|---|---|---|---|---|
| Under $1M | 9% | 5% | 14% | 36% |
| $1M to $3M | 10% | 5% | 15% | 33% |
| $3M to $5M | 11.5% | 10% | 21.5% | 47% |
| $5M to $10M | 15% | 10% | 25% | 40% |
| $10M to $20M | 16% | 10% | 26% | 38% |
| Over $20M | 18% | 9% | 27% | 33% |
| All companies (published medians) | 15% | 8% | 23% | 35% |
Two cautions. Adding two medians does not give the median of the total, so the sums are approximations. And SaaS Capital’s text gives 12% and 8% for the $3M to $5M band where its chart reads about 11.5% and 10%; on the text figures that row would be 20% and 40%.
The pattern holds under either reading. Below $3 million in ARR, the median software company spends about 5% on marketing and about 15% on sales and marketing combined. Marketing steps up in the $3 million to $5 million band, to 10% on the chart or 8% in the text. And it takes between a third and a half of the combined budget at every size.
Benchmarkit asks about that share directly. In its 2026 plans, marketing is 30% of the sales and marketing budget at the median, with the middle half running from 16% to 45% across 131 companies. Companies growing faster than 20% put 35% into marketing. That is a correlation, and the report does not show which causes which.
A Method for Setting the Number
The method has four steps, and the benchmark comes last.
Start With What You Can Pay for a Customer
Customer acquisition cost (CAC) payback is the number of months a new customer takes to repay the sales and marketing cost of winning them. It turns a growth target into a spending ceiling.
Aleph’s summary of the benchmark report it published with Benchmarkit on June 1, 2026 gives a median of 16 months on full-year 2025 data, down from 18, with 198 of 342 companies reporting the metric. For companies at $1 million to $5 million in ARR, Development Corporate’s write-up of High Alpha’s 2025 SaaS Benchmarks gives a median of 8 months. High Alpha’s own report is gated, so that figure is secondhand.
Illustration, with made-up inputs. A B2B software company has $2,000,000 in ARR. A customer pays $1,000 a month at an 80% gross margin. The founders want payback inside 12 months and plan to add four customers a month.
- Allowable cost per customer: $1,000 × 0.80 × 12 = $9,600
- Monthly sales and marketing ceiling: 4 × $9,600 = $38,400
- Annual ceiling: $38,400 × 12 = $460,800, which is 23% of ARR
We chose inputs that land on SaaS Capital’s 23% so the later steps are easy to compare. Real inputs will not be that tidy.
Split Sales From Marketing
Apply a marketing share to the ceiling. At Benchmarkit’s 30% median, marketing gets $38,400 × 0.30 = $11,520 a month. At the 35% that faster-growing companies report, it gets $13,440. The illustration rounds to $12,000 a month, or $144,000 a year, which is 7.2% of ARR.
A low price and a self-serve signup argue for the higher share. A five-figure contract closed by a sales team argues for the lower one.
Price the Plan at Current Costs
A percentage only means something once you know what it buys. The table divides $1,000 by each published cost per lead.
| Source and channel | Cost per lead | Leads per $1,000 |
|---|---|---|
| WordStream 2026 Facebook Ads, leads campaigns, all industries | $27.39 | 36.5 |
| WordStream 2026 search ads, all industries | $66.69 | 15.0 |
| WordStream 2026 search ads, attorneys and legal services | $131.63 | 7.6 |
| Metadata 2026 B2B, Facebook | $145 | 6.9 |
| Metadata 2026 B2B, LinkedIn | $202 | 5.0 |
| Metadata 2026 B2B, Google Ads | $524 | 1.9 |
The WordStream figures are medians from U.S. campaigns: 13,474 search campaigns on Google Ads and Microsoft Ads across 23 industries, as reported by PPC Land, and 1,892 Facebook campaigns split between the traffic and leads objectives, so the cost per lead comes from only part of that sample. Neither has a B2B software row. Metadata’s come from 153 B2B advertisers and $57.6 million of 2025 ad spend on its own platform, and the report tells readers to benchmark a LinkedIn lead against $376, which it calls “the middle of the market.”
The same $1,000 buys 36.5 leads in one row and 1.9 in another. A percent-of-revenue benchmark carries no information about which row you are in. If paid media is the program you are pricing, Triaza’s paid advertising service plans and manages campaigns around a set budget and conversion goal.
The people who run the programs have a price as well. In SparkToro’s agency survey, published January 7, 2026, 49% of agencies reported an average monthly retainer between $1,000 and $5,000, and 31% between $5,000 and $10,000. Go Fractional’s 2026 report lists an average fractional CMO rate of $176 an hour, from a marketplace that posted 27 CMO jobs in 90 days. The report also separates what employers post from what candidates ask: live job listings average $127 an hour, and the rates candidates set on their profiles average $178.
Check It Against the Row That Looks Like You
Now the benchmark comes in. The illustration’s $144,000 is 7.2% of ARR. SaaS Capital’s rows for a $2 million company are $100,000 at the bootstrapped 5%, $160,000 at the 8% median and $200,000 at the equity-backed 10%. The plan sits inside the range, a little under the median.
Had the customer math produced 20%, the benchmark would not prove the plan wrong. It would put the company just under the 75th percentile of Benchmarkit’s sub-$5M actuals for 2025, which was 23%, and at more than three times the 6% median plan for 2026. That is a position worth being able to explain.
An Illustrative Allocation
Benchmarkit’s 2026 plans put the median share of the marketing budget at 46% for people, 40% for programs and 10% for technology, across 118 companies. Each is a separate median, so the three do not have to total 100%, and they add to 96%. The table applies them to the illustration’s $12,000 a month and holds the remaining 4% as a test reserve, which is our assumption.
| Line | Share | Per month | Per year |
|---|---|---|---|
| People (staff, agency or fractional) | 46% | $5,520 | $66,240 |
| Programs (ads, content, events) | 40% | $4,800 | $57,600 |
| Technology | 10% | $1,200 | $14,400 |
| Test reserve | 4% | $480 | $5,760 |
| Total | 100% | $12,000 | $144,000 |
The people line buys $5,520 ÷ $176 = 31 hours a month of a fractional CMO at Go Fractional’s average rate, about seven hours a week. At the $127 that employers post, the same money buys about 43 hours. The line also sits just above the retainer band that about half of SparkToro’s agencies report. Over a year it comes to under a fifth of the roughly $360,000 a year that Go Fractional’s report puts on a full-time CMO.
If the whole programs line went to LinkedIn at Metadata’s $202, it would buy $4,800 ÷ $202 = 24 leads a month. Four new customers from 24 leads means one in six has to close. If you cannot say whether that rate is realistic for your company, find out before you commit the money; how leads move from marketing to sales is the place to look. If it is not realistic, some of the four customers have to come from referrals, outbound or content that earns its own traffic, or the target has to change.
The technology line is $1,200 a month for everything. Our guide to the AI marketing stack for lean teams sorts tools by the job they do.
What to Assume About 2027
The safer planning assumption is flat. In the CMO Survey, leaders expected their marketing budgets to rise a mean 7.61% over the next 12 months. Their spending over the prior 12 months had risen a mean 1.74%, with a median of zero and a confidence interval that includes zero. Gartner’s figure moved a tenth of a point. Benchmarkit’s median plan fell from 10% of revenue for 2025 to 9% for 2026.
None of those sources surveyed 2027 budgets. They show leaders expecting an increase after a year in which spending barely moved, while the most recent plans came in level or lower.
How We Checked This
With three exceptions, every benchmark here comes from its original report, release or chart, and each linked source was checked against the figures quoted here on November 11, 2026. The exceptions are secondhand: WordStream’s search benchmarks came through PPC Land’s report, High Alpha’s payback figure through Development Corporate, and the Aleph and Benchmarkit payback figures through Aleph’s summary page. Gartner’s release was read on Gartner’s press-release mirror, and the 2012 SBA post in a university web archive.
We calculated four things: the dollars-per-$1M column, the sales-plus-marketing sums and marketing shares from SaaS Capital’s chart, leads per $1,000, and the arithmetic in the illustration. The chart readings are by eye and good to about half a point. The illustration’s inputs are invented.
This article contains no client data and no survey of our own. Six sources predate 2026: the SBA post and worksheet, one CMO Survey comparison from 2025, Benchmarkit’s 2025 edition, High Alpha’s 2025 report and Development Corporate’s November 2025 write-up of it. Everything else was published in 2026.
Frequently Asked Questions
What percentage of revenue should a startup spend on marketing?
Current benchmarks run from about 5% to 13%. SaaS Capital’s 2026 survey of private B2B SaaS companies gives a median of 8% of ARR, with bootstrapped companies near 5% and equity-backed near 10%. The CMO Survey’s 2026 breakout gives a mean of 13.34% for companies under $10 million, from 20 respondents. Pick the source whose sample resembles your company.
Does the SBA recommend spending 7% to 8% of revenue on marketing?
Only as a rule of thumb. The figure comes from a 2012 post on the SBA’s community blog that cited no data and assumed margins of 10 to 12 percent, and an SBA worksheet repeats it. The same post mentioned 2 to 3 percent and 3 to 5 percent as common allocations.
How much should a pre-revenue startup budget for marketing?
No benchmark in this article covers a company without revenue, and a percentage of zero is zero. SaaS Capital’s lowest band, under $1 million in ARR, shows about 5% on marketing and 9% on sales. Before revenue, build the budget from costs: list what winning the first customers requires, price it with the cost table above, and size it against your runway.
Do these percentages include salaries and agency fees?
Benchmarkit’s do. Its 2026 report gives median shares of the marketing budget for people (46%), programs (40%) and technology (10%). SaaS Capital asks what percentage of revenue is spent on each function, with the answers adding up to the company’s total spending. That suggests a full department cost, though the survey does not define marketing. The CMO Survey asks about marketing expenses, and its topline report does not define the term either. When you compare your own number, include people.
How much does an agency or a fractional CMO cost?
In SparkToro’s survey, 86% of agencies reported an average monthly retainer of up to $10,000. Go Fractional’s 2026 report puts the average fractional CMO rate at $176 an hour, with the middle half between $125 and $200. Its employer job listings average $127 an hour and its candidate profiles $178. SparkToro’s figure is what agencies report charging, and Go Fractional’s rates are a mix of what employers post and what candidates ask. Neither shows what startups in particular pay.
Put a Date on the Review
A budget built this way is a set of assumptions: a payback target, a close rate, a cost per lead. Write them next to the number and check them against actuals each quarter.
The benchmarks will move too. The CMO Survey lists its next survey for January 2027, and Gartner has released its spend survey each May for the past three years. If you want help building the plan behind the number, Triaza’s marketing strategy service covers strategic planning and performance tracking.