You know the meeting. Organic sessions are down quarter over quarter, rankings haven’t moved, the content calendar shipped everything it promised, and somebody senior asks whether the content program is still worth what it costs. You have thirty seconds to answer and the only number on the slide is the one that’s falling.
The instinct in that moment is to go fix attribution: better UTM hygiene, a new model in the analytics tool, maybe a vendor. That instinct is aimed at the wrong problem. Attribution isn’t what broke. What broke is that the click stopped being a reliable receipt for attention. People are reading answers built partly from your content and never arriving on your site, and no attribution model can recover an event that never happened. If you need the strategic backdrop first, our guide to how search and AI-driven answers now work together covers it.
So the job isn’t to reconstruct the missing clicks. It’s to change what you report, on purpose, and to be able to defend the change to someone who has been looking at a sessions chart for five years. Here’s the measurement set that holds up, how to instrument each piece with the tools you already pay for, and how to walk your leadership through a declining traffic line without either panicking them or overclaiming.
The Short Answer: Measure Visibility, Engagement, and Demand
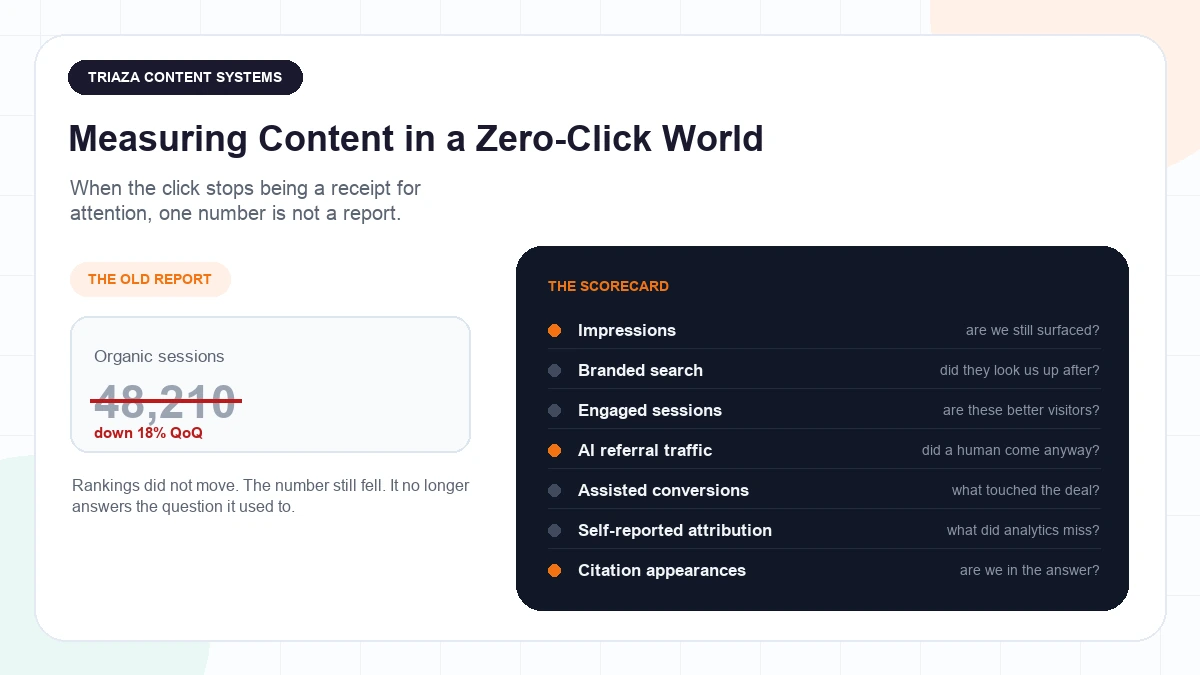
Content performance in a zero-click world is measured with a scorecard, not a single number. Track search impressions and branded search volume for visibility, engaged sessions for quality, AI referral traffic as its own line, assisted conversions alongside last-touch, self-reported attribution on your highest-intent form, and how often AI answers cite you. Sessions alone understate what content is doing.
Seven rows, and each one answers a question the others can’t. Impressions tell you whether you’re still being surfaced. Branded search tells you whether people who saw you went looking for you afterward. Engaged sessions tell you whether the visitors you do get are better or worse than before. AI referral traffic tells you that a human read a generated answer and came anyway. Assisted conversions tell you what content touched a deal it didn’t close. Self-reported attribution catches the discovery your analytics never saw. Citation tracking tells you whether you’re in the answer at all.
None of these is as clean as a session count. That’s the trade. A single number that no longer describes reality is worse than seven numbers that each describe part of it, and the sooner your reporting reflects that, the sooner your content decisions get better.
Why Session Counts Stopped Describing Content Performance
Most Searches Already Ended Without a Click
Before AI Overviews were widespread, most Google searches already ended on the results page. SparkToro’s zero-click study with Datos, published in July 2024, found that 58.5% of US Google searches ended without a click to any website, and that for every 1,000 US searches only 360 clicks went to the open web. Those figures come from a clickstream panel rather than from Google, with desktop data spanning September 2022 to May 2024 and mobile data only from January 2024, minimal iOS coverage, and no control for ad blockers, which the study notes various estimates put at 31% to 50% of US devices and which likely inflate the apparent organic share of clicks.
Carry that baseline into every conversation about AI, because it reframes the argument. The zero-click problem is not new and AI did not create it. What AI changed is the slope.
When an AI Overview Appears, the First Result Loses Clicks
Ahrefs published a study in April 2025 comparing March 2024 with March 2025 Search Console data across 300,000 keywords, half of which triggered an AI Overview. Pages ranking first saw an average click-through rate 34.5% lower when an AI Overview was present. Read that with the authors’ own limits attached: the sample is informational keywords only, Search Console cannot isolate AI Overview clicks, which makes this a correlation across keyword cohorts rather than a page-level causal measurement, and Ahrefs notes the figure is likely the mildest version of the effect rather than the worst.
If you want the mechanics of how those answers get assembled and which pages get cited inside them, our AI Overviews explainer covers that ground. This article stays on the measurement question.
The Damage Is Uneven, and the Pattern Tells You Where to Look
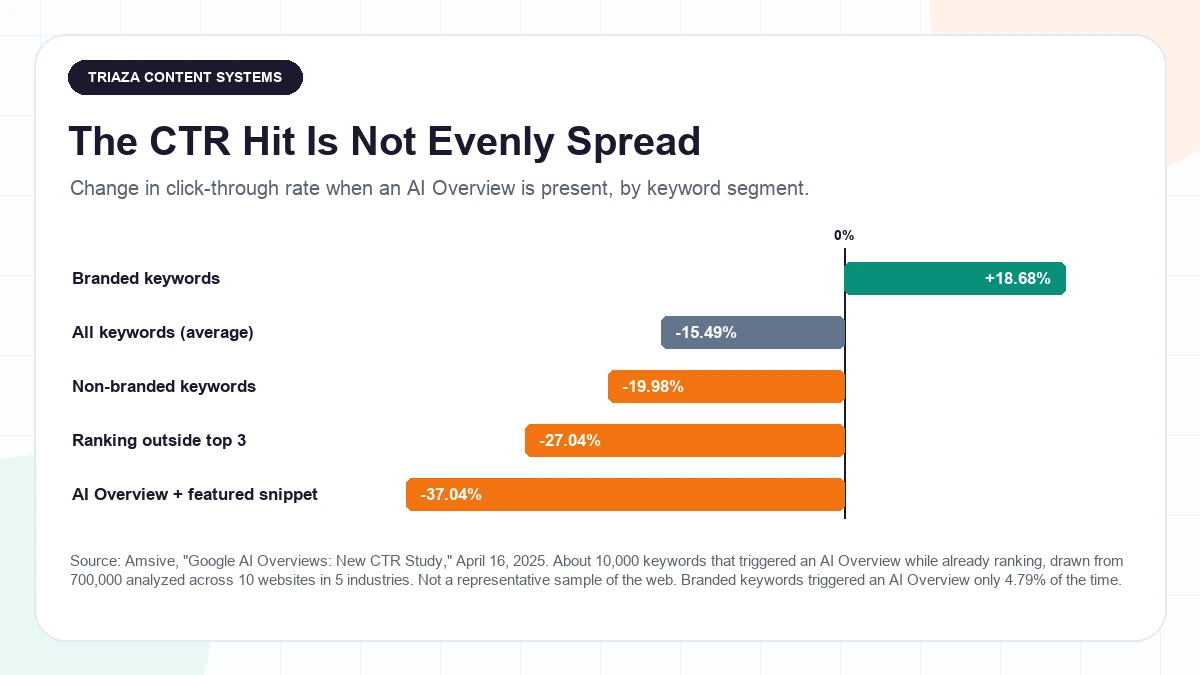
The average is the least useful number in this whole area. Amsive’s CTR study, published in April 2025, segmented the effect and found a 15.49% average CTR decline overall, but a 19.98% decline on non-branded keywords, 27.04% for keywords ranking outside the top three positions, and 37.04% where an AI Overview and a featured snippet appeared together. Branded keywords went the other way, gaining 18.68% CTR, and triggered AI Overviews only 4.79% of the time. That analysis covers roughly 10,000 keywords that both triggered an AI Overview and already ranked, drawn from 700,000 analyzed across just ten websites in five industries, so it’s a directional pattern from a narrow sample rather than a representative measure of the web.
The operational read is worth more than the headline. If your losses are concentrated in non-branded informational content sitting mid-page-one, that’s consistent with this pattern and it tells you something about your content mix, not just your traffic. If your branded terms are holding or growing, that’s consistent too.
Google’s Counter-Position, and Why It Can’t Settle This
Google’s position is that this is overstated. In its AI Overviews launch post in May 2024, the company said links included in AI Overviews get more clicks than the same page would have received as a traditional web listing. Take it for what it is: an unquantified, self-reported observation about its own product, with no sample size, no measurement window, no comparison method, and no control group disclosed anywhere in the post.
Include it in your reporting for balance, because a leadership team that hears it elsewhere should hear it from you first. Do not treat it as evidence that settles anything, and be honest about why it can’t be checked: Search Console does not break out AI Overview clicks, so you cannot verify the claim against your own data even if you want to.
The Diagnostic That Matters: Flat Rankings, Falling Sessions
Here’s the pattern worth learning to recognize, offered as a diagnostic heuristic rather than a measured finding. Positions stable, impressions stable or rising, clicks down, CTR down. That shape is consistent with click compression on the results page rather than with a ranking loss, an algorithm hit, or seasonality, all of which move impressions or positions too.
Knowing the difference changes what you do next. A ranking loss is a content and authority problem. Click compression on stable rankings is a measurement and packaging problem, and the fix is a different set of KPIs plus work on being quotable, not a panic rewrite of pages that are still ranking exactly where they were.
The Replacement KPI Set, and What Each One Proves
No single metric survives this transition on its own. Each of the following measures something real and misses something else, so they’re built to be read together.
Branded Search Lift, the Closest Thing to a Zero-Click Proxy
If someone reads about you inside a generated answer and never clicks, the trace they leave is searching your brand later. Segment branded from non-branded queries in Search Console, track branded impressions and clicks as a trend against your publishing volume, and allow a lag of weeks rather than days.
This is practitioner reasoning, not a measured finding, and we’d rather say so than dress it up. Branded search is lagging and noisy, it moves with paid media and PR and product news as much as with content, and if you launch a campaign in the same month you’ll never untangle the two. Its value is that it’s the only widely available signal that responds to attention you can’t otherwise see, and it’s free.
Impressions and Position, With a Caveat You Have to Explain
Impressions are now the closest thing you have to a visibility measure, and they come with a complication you need to be able to state out loud. Since June 16, 2025, AI Mode impressions, clicks, and positions count toward the totals in the Search Console Performance report, and there is no filter to isolate them. Each follow-up question inside an AI Mode conversation counts as a separate query for attribution purposes. AI Mode has been generally available to US users since May, so this is not a rounding error on a niche surface.
The practical consequence: a rising impressions total is real, but you cannot attribute it to any one surface, and neither can anyone else in the room. Say that before someone else finds it.
Engaged Sessions and Depth Per Visit
Fewer visitors can be better visitors, and there’s dated evidence for it in at least one vertical. Adobe Analytics reported in March 2025 that traffic to US retail sites from generative AI sources showed 8% higher engagement, 12% more pages per visit, and a 23% lower bounce rate than other traffic, while converting 9% less often, an improvement from a 43% conversion gap the previous July. Adobe attributes the lower conversion rate to AI’s role in the research and consideration stage rather than to a defect in the traffic, and cautions that this traffic remains modest next to channels like paid search or email. It’s drawn from Adobe’s own analytics panel across US retail sites, so treat it as directional for a B2B audience rather than as a number you can expect to reproduce.
Whatever your vertical, put engaged sessions and pages per visit on the scorecard next to raw sessions. When the two lines diverge, that divergence is the story.
Assisted Conversions and the End of Last-Touch
Last-touch attribution systematically underprices content, and it gets worse as discovery moves off your site. The article that shaped the buyer’s thinking in March cannot win credit for a demo request in July if the last click before the form was a branded search. Report assisted conversions and content-influenced pipeline alongside last-touch rather than instead of it, and show both numbers so nobody thinks you picked the flattering one.
If it helps to know this isn’t a local failure: in the 2025 B2B Content Marketing benchmarks from Content Marketing Institute and MarketingProfs, 56% of respondents cited difficulty attributing ROI to content as an organizational challenge, and only 51% agreed their organization measures content performance effectively. That’s self-reported perception from 980 B2B marketers surveyed between late June and mid-August 2024, with a North America skew, so it describes how marketers see their own measurement rather than an audit of it. Building the measurement layer alongside the content is most of what our content marketing engagements actually involve, because a program nobody can defend gets cut in the first budget round regardless of what it produced.
AI Referral Traffic, as Its Own Line Item
AI referral traffic deserves its own row even while it’s small, because it’s the only direct evidence that a human read a generated answer and came to you anyway. Size it honestly. In retail, Adobe reported in March 2025 that traffic from generative AI sources was up 1,200% in February 2025 against a July 2024 baseline, measured on Adobe’s own analytics panel across US retail sites, and from a small enough starting point that Adobe itself notes the volume remains modest compared with paid search or email.
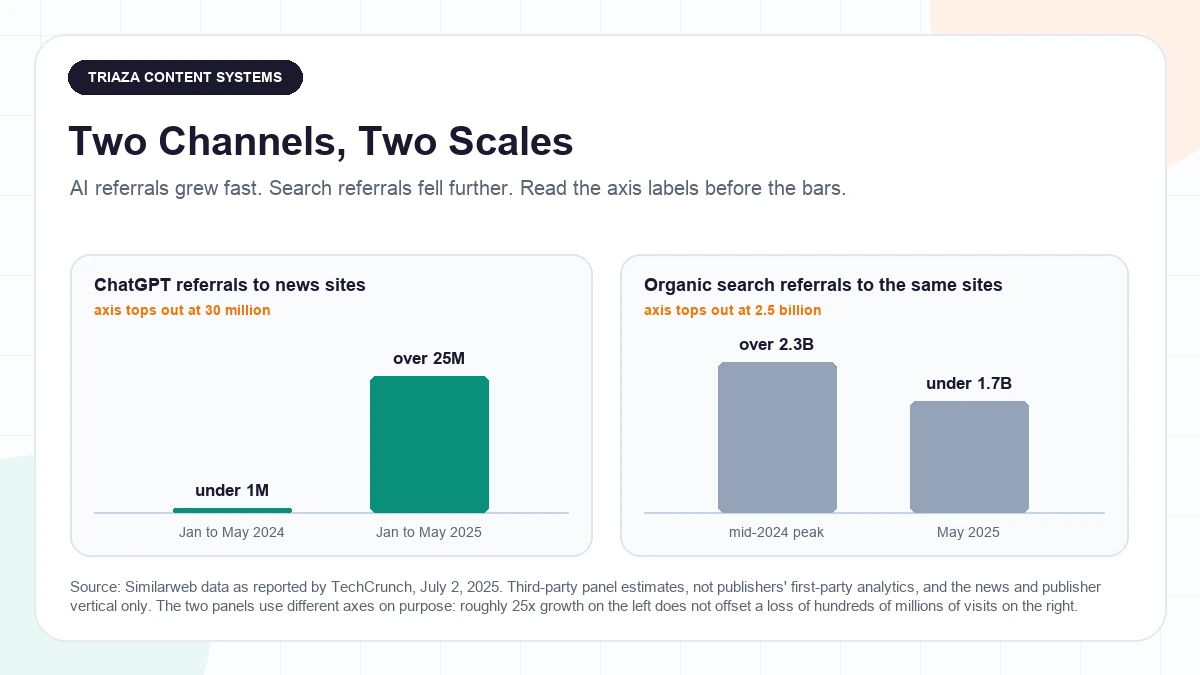
The publishing numbers show the same shape at larger scale. Similarweb data reported by TechCrunch on July 2, 2025 shows ChatGPT referrals to news sites growing roughly 25 times over, from under 1 million visits in January through May 2024 to more than 25 million in the same months of 2025, while organic search referrals to those same sites fell from over 2.3 billion at their mid-2024 peak to under 1.7 billion by May 2025. Those are third-party panel estimates for the news vertical rather than publishers’ own analytics, and the framing matters as much as the figures: the growth is real and it is nowhere near enough to offset the decline.
Self-Reported Attribution, the Cheapest Instrument You’re Not Using
Add “How did you first hear about us?” to your highest-intent form. It’s the one instrument that captures discovery your analytics never recorded, including the conversation with an AI assistant that sent nothing you could log.
Keep the implementation modest: open text plus a short option list, on one form rather than every form, reviewed qualitatively once a month. Expect vagueness, expect blanks, and don’t reconcile it against last-touch as though one of them must be lying. This is practitioner practice rather than a measured method, and it earns its place because it’s nearly free and it’s the only question that reaches the part of the funnel your tooling can’t see.
Citation Share in AI Answers, the Newest and Weakest Metric
Citation share is how often your brand or domain appears in generated answers to a fixed set of prompts. It’s worth tracking and it’s the softest number on the scorecard. There’s no standard for calculating it, no audited methodology from any vendor, and no comparability between tools. Track it as an internal trend line and label it that way wherever it appears.
How to Actually See AI Referral Traffic in Your Analytics
Why Most of It Was Landing in Direct
Links that arrive without a referrer header or without tracking parameters get bucketed as direct traffic, which is where a great deal of AI referral traffic has been hiding. Some of that changed in mid-June 2025, when ChatGPT began appending a utm_source parameter to the previously untagged links in the additional-sources section of its web interface, a change SEO consultant Glenn Gabe first flagged on June 13. Scope that carefully before you celebrate: it covers the web interface’s additional-sources section only, citation links already carried parameters before the change, and the reporting says nothing about the mobile app or any other surface.
There’s a reporting trap buried in this. If some of your AI referral traffic was landing in direct and now lands in referral, your AI referral line will jump in a way that looks like growth and isn’t. Annotate the date.
The Native App Blind Spot Nobody Can Close Yet
Cloudflare’s crawl-to-refer analysis on July 1, 2025 found that for the week of June 19 to 26, Anthropic’s Claude generated an estimated 70,900 HTML page crawl requests for every referral visit it sent back, while Mistral sat around 0.1 to 1, sending roughly ten times as many referrals as crawl requests. Cloudflare states the important caveat directly: referrals from Claude’s native app, and likely other providers’ native apps, send no referrer header at all, so its referral counts capture browser-based traffic only and the ratios may overstate the imbalance by an amount it says is unclear.
For your purposes the ratio is less important than what it implies. Any AI referral number you report is a floor, not a total. Put that sentence in the report itself.
Build the Channel Group Yourself
There’s no native AI-assistant channel grouping in GA4 right now, so you build one. Maintain a list of AI assistant referral hostnames, define a custom channel group from it, save an exploration you can open without rebuilding it every month, and use a consistent UTM convention on any owned links you place where assistants can reach them.
That’s implementation guidance rather than measurement evidence, and it comes with a maintenance cost worth naming up front: the hostname list goes stale fast, because new surfaces keep appearing. Put a recurring fifteen minutes on the calendar to review it, or the channel group quietly becomes wrong and you won’t notice until a quarterly review.
Don’t Confuse Crawler Traffic With Audience
This is the most common measurement error in the whole area and the easiest to avoid. Server logs show AI crawlers hitting sites hard. Vercel’s December 2024 analysis of its own network counted roughly 569 million monthly fetches from OpenAI’s crawler and about 370 million from Anthropic’s, against roughly 4.5 billion from Googlebot, with the combined AI crawler total described as a little over 28% of Googlebot’s volume. That’s specific to Vercel’s network with deeper validation on only two sites, and it excludes Microsoft Copilot, which has no distinct crawler user agent.
Now the point. Those are bot fetches. Ingestion is not an audience, a crawl is not a visit, and crawler volume must never appear on a leadership slide as traffic. It’s a useful number for a completely different question, which is whether the systems that build answers can reach your content at all.
How to Track AI Citations Without Pretending You Have Attribution
Start With a Prompt Set, Not a Keyword List
Write 20 to 40 prompts in your buyers’ language, mapped to stages of your funnel, and run them on a fixed schedule. Log three things each time: whether you appeared, in what role (cited source, named recommendation, unnamed mention), and who appeared instead when you didn’t.
This is recommended practice rather than a measured method, and it works because of one property of the thing being measured: generated answers are non-deterministic, so a single check proves nothing in either direction. Only the trend across repeated runs carries information, which is why the fixed schedule matters more than the sophistication of the prompts. Our AI search visibility audit guide walks through building that prompt set if you’re starting from nothing.
What the Monitoring Tools Do, and What They Don’t
A caveat that applies to everything in this paragraph: these are vendor-described capabilities, not independently verified measurement, and none of them discloses how its visibility figures are calculated. Semrush announced an AI Toolkit in March 2025 including an AI Market Share Tracking feature it describes as measuring how often a brand appears in AI-generated results. Scrunch AI launched out of beta the same month on a $4 million seed round led by Mayfield, naming more than 25 early customers including Lenovo, Crunchbase, and Penn State. Profound raised a $20 million Series A led by Kleiner Perkins in June 2025. Otterly.AI came out of stealth in December 2024 with weekly automated tracking across ChatGPT, Perplexity, and Google AI Overviews, reporting more than 1,000 users, a self-reported figure, and no outside venture funding, though it does have incubator support.
What that roundup supports is narrower than it looks: the category is real, funded, and buyable. It does not establish that any of their numbers are trustworthy. If tooling budget is the constraint, we sorted the wider question of what a lean team should actually pay for in our guide to the AI marketing stack.
The Free Version
A spreadsheet, a fixed prompt list, one manual run a month, three columns, and a folder of screenshots. It’s crude, it takes half an hour, and it will tell you the direction you’re moving long before it tells you your position. For most teams below a certain size that’s the correct amount of instrumentation for a metric this immature.
Optimize for Being Quotable, Not Just Rankable
Measurement and practice meet here. Answer engine optimization (AEO) is the work of structuring content so that generated answers can lift a clean, attributable claim out of it: answer-first sections, defined claims that survive being quoted alone, clear entity language, and original data nobody else has. Our answer engine optimization guide covers the practice properly, and the AI search work we do for clients is built around it.
Two things this does not mean. It doesn’t mean adding schema or a text file at your domain root and calling it done; nothing has demonstrated that either of those flips a switch. And it doesn’t mean chasing freshness dates. The content that gets quoted is the content that’s worth quoting.
Building a Reporting Cadence You Can Sustain
Everything in this section is recommended practice rather than a measured finding. It’s the cadence we’d defend to a skeptical CFO, and it’s built to be sustainable by one person.
Weekly Flags, Monthly Trends, Quarterly Decisions
Weekly, you flag anomalies and explain nothing. Anything can move in a week and most of it means nothing. Monthly, you publish the scorecard and read trends. Quarterly, you make content decisions: what to kill, what to double down on, what to rebuild. Keeping those intervals separate is most of what stops a measurement practice from collapsing into weekly firefighting, and it also stops you from acting on noise.
The One-Page Content Scorecard
One page, ten rows:
- Impressions
- Clicks
- Click-through rate
- Branded versus non-branded split
- Engaged sessions
- AI referral sessions
- Assisted conversions
- Last-touch conversions
- Self-reported attribution mentions
- Citation appearance rate
Two columns of context on every row, the prior period and a rolling baseline, because a number with no comparison invites everyone in the room to supply their own.
If you’re rebuilding the production process at the same time as the reporting, the two should be designed together. We wrote about the production half of that in our AI content system piece.
Set the Baseline Before You Need It
The reason the Ahrefs study can say anything at all is that it compares March 2024 with March 2025. You need a pre-change baseline to describe a change, and if you don’t have one, today is the cheapest day you will ever have to set one. Export a full year of Search Console data before the window rolls off, and keep exporting it.
Then annotate everything: algorithm updates, site migrations, tracking changes, template changes, and the June 2025 parameter change described above. On an unannotated chart, an attribution improvement is indistinguishable from growth, and someone will eventually present it as growth.
How to Report This Upward When Leadership Wants a Traffic Number
Give Them the Number They Asked For, Then Reframe It
Never open with the methodology lecture. Lead with sessions, because that’s what was asked for and refusing to show it reads as evasion. Put impressions next to it. Then explain the divergence in one sentence, not five.
Show the Denominator, Not Just the Numerator
The single most persuasive chart for a skeptical executive is impressions flat or rising while clicks fall, because it separates two things that look identical on a sessions chart: losing visibility, and visibility that stopped converting into visits. Those have completely different responses, and the chart makes the distinction without you having to argue for it.
Then supply the market context in two lines. SparkToro and Datos found 58.5% of US Google searches ended without a click, from a clickstream panel with limited mobile and iOS coverage and no control for ad blockers. Ahrefs found pages ranking first saw a 34.5% average CTR drop when an AI Overview appeared, across informational keywords only, as a cohort-level correlation rather than a causal measurement. Both hedges belong in the speaking notes, not just the appendix.
Normalize the Uncertainty Instead of Hiding It
Two survey numbers do real work in an executive room, because they establish that the difficulty is structural rather than a failure of your team. In CMI and MarketingProfs’ 2025 B2B benchmarks, 56% of B2B marketers cited difficulty attributing content ROI and only 51% agreed their organization measures content performance effectively, both self-reported by 980 respondents surveyed in mid-2024 with a North America skew.
Name What You Can’t Measure, on the Slide
Every report gets a short known-blind-spots block: AI Mode clicks and impressions sit inside the Search Console totals and can’t be isolated, native-app AI referrals send no referrer so the AI referral line is a floor, and vendor visibility scores use undisclosed methodology. Stating limits raises your credibility rather than lowering it. The alternative is a confident number that falls apart the first time somebody probes it, and it will get probed.
What Not to Over-Claim
“AI Traffic Is Replacing Search Traffic”
Not yet, and not in the one vertical with dated numbers. ChatGPT referrals to news sites grew roughly 25 times over to more than 25 million while organic search referrals to those sites fell from over 2.3 billion to under 1.7 billion, per Similarweb estimates reported by TechCrunch in July 2025, third-party panel estimates for the news vertical rather than publishers’ own analytics. Growth of that shape does not offset a loss of that scale, and saying otherwise in a board deck will cost you credibility later.
“Our AI Visibility Score Is Our Market Share”
No vendor in this space discloses how visibility or share is calculated, what its prompt selection is, or what sample sits behind the number. Treat these tools as internally consistent trend instruments. A vendor score should never appear as a board-level KPI without its methodology caveat sitting next to it.
“AI Overviews Caused Our Traffic Drop”
The available studies are cohort-level correlations, not page-level causal measurements, and Search Console cannot isolate AI Overview clicks. Amsive’s own segmentation shows the effect swinging hard by query type, with branded keywords gaining 18.68% CTR while non-branded fell 19.98%, across roughly 10,000 keywords from ten sites in five industries. Say “consistent with” instead of “caused by” and you’ll never have to walk it back.
“Crawler Traffic Is Audience”
Bot fetches are ingestion. Vercel’s network numbers are useful for judging whether AI systems can reach your content, and they say nothing whatsoever about whether humans arrived.
Your First 30 Days: A Measurement Reset
A recommended sequence, not a standard.
- Week one, set the baseline. Export a full year of Search Console data before the window rolls off, split branded from non-branded, and record where you’re starting.
- Week two, instrument the gap. Build the AI referral channel group in GA4 and start the annotation log, backfilling any tracking or template changes you can still reconstruct.
- Week three, add the two cheap inputs. Put the self-reported attribution question on your highest-intent form, and write the prompt set for citation tracking.
- Week four, rebuild the report. Assemble the monthly scorecard around the ten rows above, run it once against last month’s data so you know it works, and rehearse the three-sentence version you’ll say out loud when the sessions line comes up.
Questions Marketers Keep Asking About Zero-Click Measurement
How do I prove content is working when Google answers the question and nobody clicks? Shift the proof from clicks to a scorecard: Search Console impressions and branded search volume for visibility, engaged sessions for quality, AI referral traffic as its own line, assisted conversions next to last-touch, and self-reported attribution on your highest-intent form. The context that justifies the shift is that 58.5% of US Google searches ended without a click in SparkToro and Datos’ July 2024 study, drawn from a clickstream panel with limited mobile and iOS coverage and no control for ad blockers.
My rankings didn’t drop but organic traffic did. What happened? That shape, with positions and impressions stable while clicks and CTR fall, is consistent with click compression on the results page rather than a ranking loss. Ahrefs found a 34.5% average CTR drop for pages ranking first when an AI Overview was present, comparing March 2024 with March 2025 across informational keywords; because Search Console can’t isolate AI Overview clicks, that’s a cohort correlation rather than proof about your specific pages. Diagnose before you rewrite anything.
How do I see traffic from ChatGPT and other AI assistants in GA4? There’s no native AI-assistant channel grouping, so build a custom channel group from a maintained list of AI assistant referral hostnames and save an exploration against it. Since mid-June 2025 ChatGPT has appended a utm_source parameter to previously untagged links in the additional-sources section of its web interface, which recovers some traffic that used to land in direct, though that covers the web interface only. Treat whatever you measure as a floor, since native-app referrals send no referrer at all.
Can I track whether AI answers cite my brand, and is a tool worth paying for? Yes, imperfectly. Run a fixed set of 20 to 40 buyer-language prompts on a schedule and log whether you appear and in what role, since answers are non-deterministic and only the trend means anything. Paid tools exist: Semrush announced an AI Toolkit in March 2025 and Profound raised a $20 million Series A in June 2025, but none discloses how its visibility numbers are calculated, so a spreadsheet is a defensible starting point.
Isn’t AI referral traffic about to replace search traffic? Not on the evidence available. Similarweb data reported by TechCrunch in July 2025 shows ChatGPT referrals to news sites growing roughly 25 times over to more than 25 million while organic search referrals to those sites fell from over 2.3 billion to under 1.7 billion, third-party panel estimates for the news vertical rather than publisher analytics. Report AI referrals as a growing line item, not as a replacement channel.
Does AI traffic convert worse? In retail, somewhat, and the gap has been closing. Adobe Analytics reported in March 2025 that visitors from generative AI sources converted 9% less often than other traffic, improved from a 43% gap the previous July, while showing 8% higher engagement and 12% more pages per visit. Adobe attributes the conversion gap to AI’s role earlier in the buying process and notes the volume remains modest next to paid search or email; it’s US retail panel data, so treat it as directional if you sell B2B.
Our server logs show huge AI bot traffic. Does that count? No. Those are crawler fetches, and ingestion is not an audience. Vercel’s December 2024 network analysis counted roughly 569 million monthly fetches from OpenAI’s crawler and 370 million from Anthropic’s against about 4.5 billion from Googlebot, on Vercel’s own network with validation on only two sites. Use crawler logs to confirm AI systems can reach your content, and never put them on a slide as traffic.
Where This Leaves Content Teams
The click was always a proxy for attention, and it’s a worse proxy now than it was two years ago. That’s the whole argument. Teams that rebuild reporting around visibility, engagement quality, and demand signals will make better decisions about what to write next than teams spending the quarter defending a sessions chart, and they’ll spend less time doing it.
Start with the baseline, because it’s the only step that gets harder the longer you wait. If you’d rather not build the measurement layer from scratch, that’s the work we do: the scorecard, the instrumentation behind it, and a content program designed to be defensible when someone asks what it returned.