Your quarterly numbers look strange in a specific way. Click volume is down. Spend is up. Cost per click is up more than you budgeted, and the increase is worst on your own brand terms, which used to be the cheap part of the account. Nothing in your campaign structure changed enough to explain it. Then someone asks whether paid is quietly covering for a problem that started in organic, and you realize you can’t answer that with the reports you have.
The page itself changed shape. When Google puts a generated summary at the top of a results page, the ten blue links don’t disappear, they move, and they move further than most people picture. Paid results are still eligible for the slot above that summary, which organic results no longer reach. That one asymmetry reorganizes what a paid team should do with its budget, its campaign structure, and its reporting.
This is about what you do on Monday, not about whether AI search is good for the web. For the mechanics of how those summaries get built, our AI Overviews explainer covers it, and our guide to PPC fundamentals is the better starting point if you’re new to paid search. What follows assumes you already run Google Ads.
The Short Answer: Buy the Top, Segment by Exposure, Measure by Increment
When AI Overviews push organic listings down, paid search becomes the most controllable path to the top of the page. Map which of your queries actually trigger AI Overviews first, then defend brand terms deliberately, treat Performance Max and AI Max as betas with limited query visibility, and grade paid on incrementality rather than last click.
Four moves, none of which requires new software. The first two are account hygiene you can do this week. The third is a posture rather than a task: resist handing more budget to automated campaign types before you can see what they’re matching against. The fourth is hardest, because it changes what you promise your leadership a report can tell them.
Order matters. Segmenting before you know your exposure produces a tidy account structure that answers the wrong question. Start by finding out whether your money is even landing on the queries where any of this applies.
What Actually Happened to the Results Page
The First Organic Result Moved Below the Fold
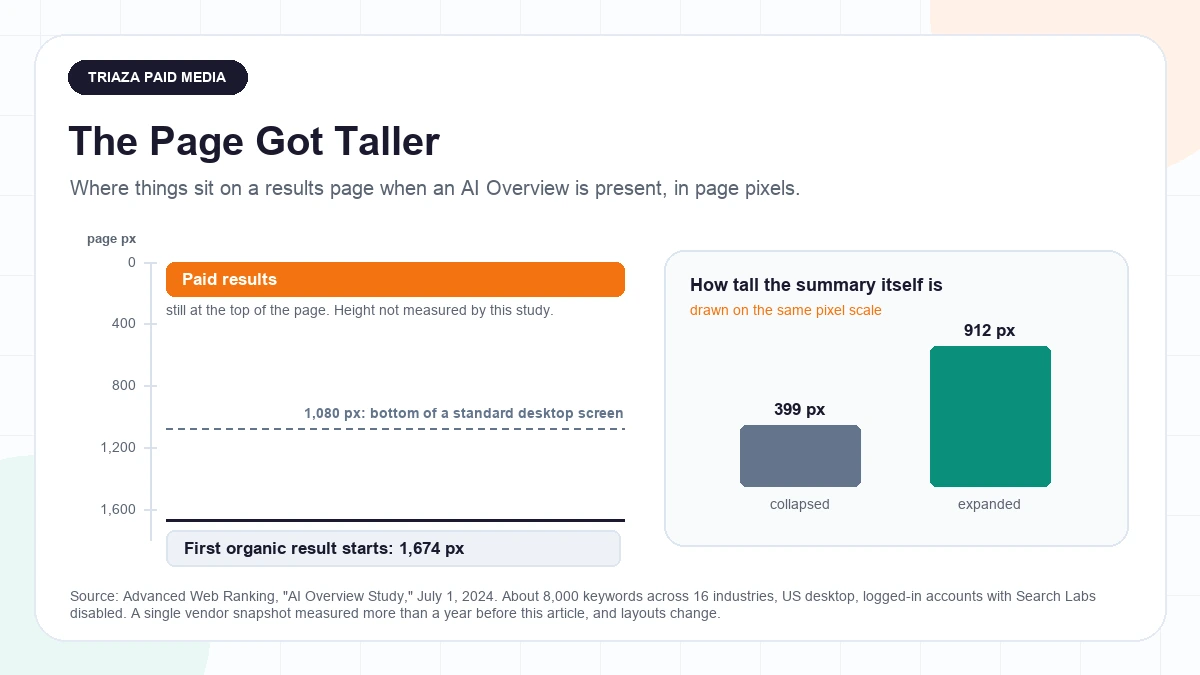
Advanced Web Ranking measured where results physically sit when a summary is present. In its study published July 1, 2024, an expanded AI Overview averaged 912 pixels tall, 399 pixels when collapsed, and pushed the first organic result to an average depth of 1,674 pixels. That’s deeper than the 1,080 pixel height of a standard desktop screen, so on a typical monitor the first organic listing starts below the fold. Read that with two limits attached: it’s a snapshot from a single rank-tracking vendor tied to its own dataset of roughly 8,000 keywords, and Advanced Web Ranking says its results “may change over time, as Google is continuously updated.” The measurement is also more than a year old at the time of writing, and layouts have almost certainly shifted since, so treat the number as an order of magnitude rather than a current spec.
The useful part isn’t the exact pixel count. It’s the ordering. The top-of-page ad slot sits above the summary, and whatever the summary does to the listings underneath it, it does not do to an ad in that slot. As the next section on placement shows, an ad can also land below the summary or inside it, so “above” is a placement you compete for rather than one you’re guaranteed.
Clicks to Links Roughly Halved When a Summary Appeared
The Pew Research Center ran the study most worth your attention, because Pew doesn’t sell search software. In work published July 22, 2025, Pew found Google visits where an AI summary appeared produced a click on a traditional result link 8% of the time against 15% without a summary, roughly half the rate, with only 1% clicking a link inside the summary itself. Pew also found people likelier to stop searching entirely: 26% of summary visits ended with no further clicks anywhere, against 16% of traditional-results visits. Pew’s own limits apply to both figures: the analysis covers Google only, because of what it calls “technical limitations in our ability to identify AI-generated summaries on other search engines,” and the browsing data comes from a single March 2025 window across about 900 US adults on its KnowledgePanel Digital panel, so it describes that state of the rollout rather than current behavior. That second number matters more to a paid team than the first, and we’ll come back to why at measurement.
Ahrefs got there from a different angle. Its study published April 17, 2025 compared March 2024 with March 2025 across 300,000 keywords and found position-one click-through rate on keywords showing an AI Overview fell from 7.3% to 2.6%, while position-one CTR on informational keywords generally fell from 5.6% to 3.1% over the same period. Ahrefs attributes roughly a 34.5% reduction in position-one CTR to AI Overview presence specifically, once that broader decline is accounted for. It is candid about the limits: it states there is “still no way to disambiguate AI Overview clicks and impressions from the rest of your Search Console data,” making this a comparative model across keyword cohorts rather than a direct measurement, and it calls the March 2025 figures “likely the highest the CTR will be” going forward. Ahrefs also sells SEO tooling. Two measurements, one non-commercial and one from a vendor that flags its own ceiling, pointing the same way.
The Damage Is Not Evenly Distributed
The averages hide the thing you’d actually act on. Amsive analyzed 700,000 keywords across ten websites in five industries and published its results April 16, 2025: keywords triggering an AI Overview lost 15.49% click-through rate overall, non-branded keywords lost 19.98%, and keywords already ranking outside the top three positions lost 27.04%. Branded keywords moved the other way, gaining 18.68%, and only 4.79% of branded queries triggered a summary at all. Amsive is an SEO agency with an interest in this narrative, and it hedges its own expertise in the same piece, writing that “while AI Overviews are on the newer side, and we’re all learning how to optimize around them, we’ve got a better grasp on how to capture Featured Snippets.”
Non-branded informational content ranking below the top three took the worst of it. Branded queries barely triggered a summary and performed better when they did. That pattern is the seed of the brand-defense argument later in this article.
Exposure Depends on Your Category More Than Your Tactics
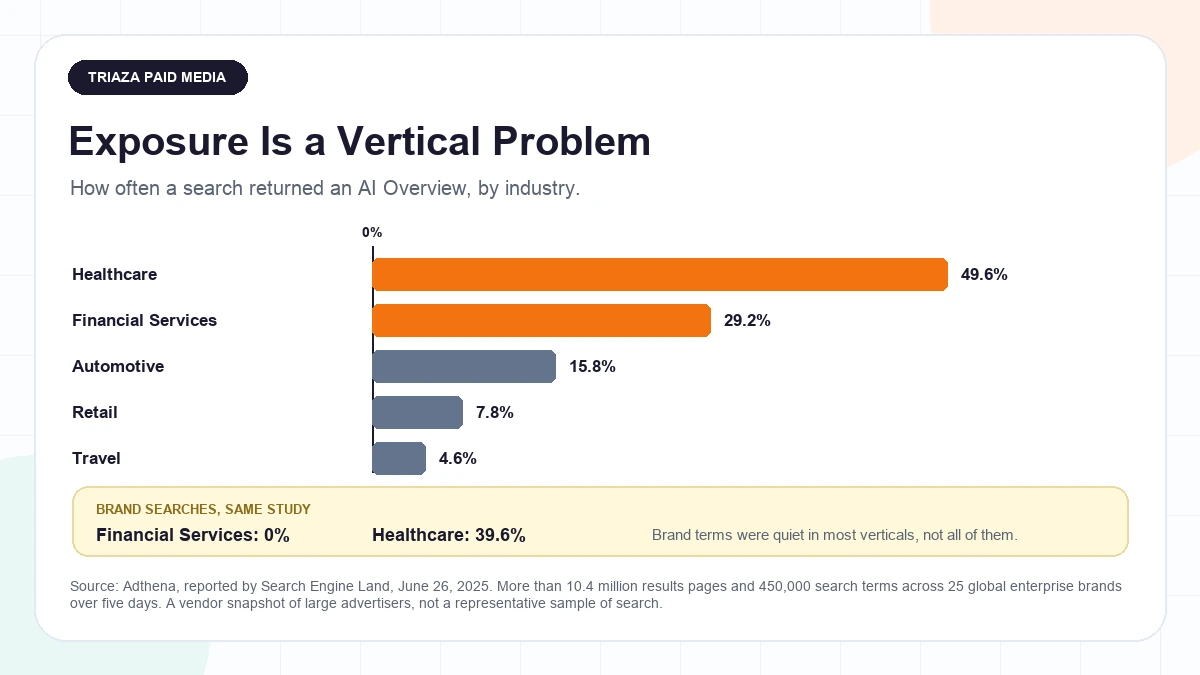
Adthena looked at more than 10.4 million search results pages, and Search Engine Land reported the findings on June 26, 2025: AI Overview presence varied from 49.6% of Healthcare queries to 29.2% of Financial Services, 15.8% of Automotive, 7.8% of Retail and 4.6% of Travel. Inside Financial Services, 29.2% of generic searches returned a summary and none of the brand searches did. Adthena is a commercial search-intelligence vendor with an interest in demonstrating disruption to paid search, and this is a five-day snapshot drawn from 450,000 search terms across 25 global enterprise brands, so it describes those brands in that window rather than search behavior generally. One number in that same analysis should stop you from over-generalizing: Healthcare brand searches returned an AI Overview 39.6% of the time, from the same five-day vendor snapshot of 25 enterprise brands. So brand immunity is not a rule. It held in the three other verticals where Adthena reported brand behavior and broke badly in Healthcare. If you’re in a regulated or health-adjacent category, check your own brand terms before you assume they’re quiet.
Summaries Mostly Land on Informational Queries
Semrush studied 200,000 US results pages that triggered an AI Overview and published in July 2025 that the large majority sat on informational queries: 80% on desktop, 76% on mobile, with transactional queries under 3% on desktop and navigational under 2%. Two caveats travel with that, and the second is the important one. Semrush is a commercial SEO vendor. More to the point, the underlying data was collected September 1 to 10, 2024, nearly a year before it was published, and Semrush states plainly that “at the time we collected this data, Google did not allow paid ads in AI Overviews.” So the transactional findings describe a page that no longer exists in the same form.
Even discounted for age, the shape is intuitive and consistent with Adthena’s vertical spread. Summaries cluster where someone is trying to learn something. Ads compete hardest where someone is trying to buy something. Those are not the same queries, which is why “AI Overviews are eating search” is a bad summary of your actual situation.
Google’s Position, and What’s Missing From It
Google disputes the traffic story. In a post on the Search blog over the signature of Liz Reid, VP and Head of Google Search, published August 6, 2025, Google stated that “total organic click volume from Google Search to websites has been relatively stable year-over-year” and that average click quality has risen, defining a quality click as one where the user doesn’t quickly click back. That post publishes no percentages, no baseline, and no methodology. Google is also grading its own homework, measuring its own effect on sites it competes with for attention, using a self-defined proxy rather than anything validated against conversions or revenue.
Compare that with how Google talks about money. On the Q2 2025 earnings call, CEO Sundar Pichai said AI Overviews were “driving over 10% more queries globally for the types of queries that show them,” and reported over 2 billion monthly users with AI Mode past 100 million monthly actives in the US and India, published July 23, 2025. That 10% applies only to query types that show a summary, not to Search overall, and it’s self-reported earnings-call commentary rather than independent measurement. On the same call, CFO Anat Ashkenazi put Search and other revenues at $54.2 billion, up 12% year over year, and Chief Business Officer Philipp Schindler said AI Overviews were monetizing “at approximately the same rate” as before, per the transcript. That monetization line is a qualitative characterization rather than a disclosed rate, delivered to investors by a company with an obvious interest in downplaying any drag.
The asymmetry is the point. Claims about your clicks arrive with no numbers. Claims about Google’s revenue arrive with figures and a filing behind them: Alphabet reported $96.42 billion in total Q2 2025 revenue, up 14% year over year, with $31.27 billion in operating income. Weight those two kinds of statement differently, and trust your own account data over either.
The Squeeze Lands on You, Not on Google
Clicks Down Two Quarters Running, Cost Up Nine Percent
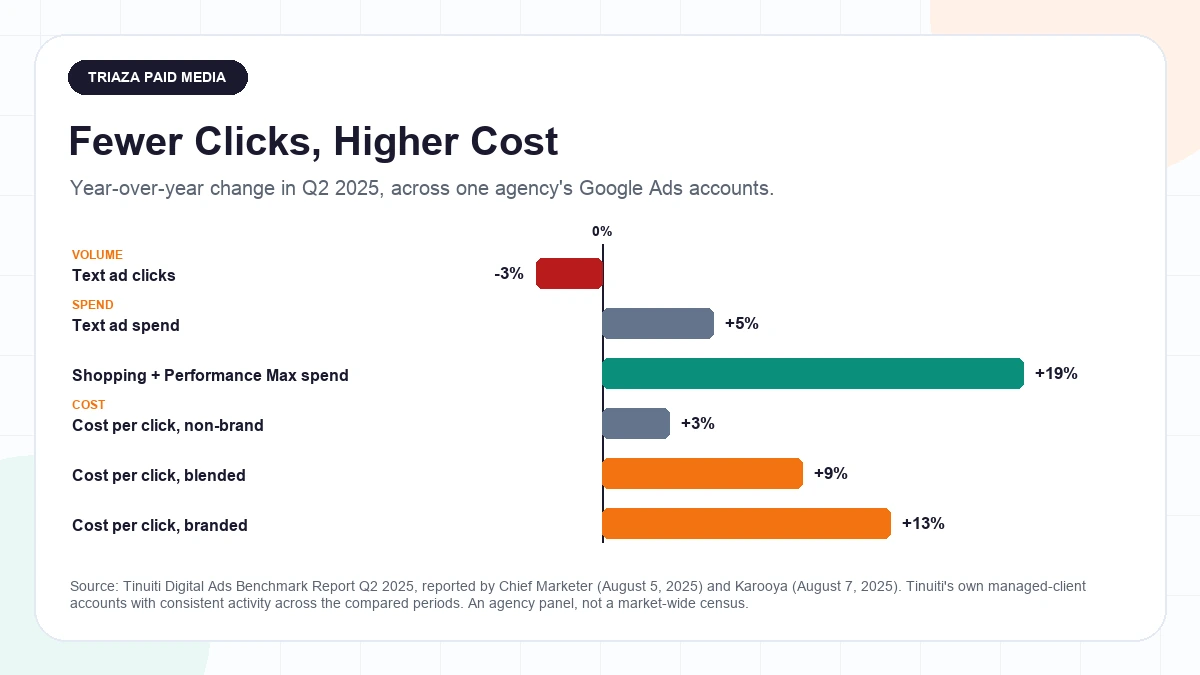
Tinuiti’s Q2 2025 benchmark report gives the clearest picture of what this felt like inside real accounts. As reported August 5, 2025, Google text ad clicks fell 3% year over year for Tinuiti-managed advertisers, the second straight quarter of decline after an identical 3% drop in Q1, while spend rose 5% and blended cost per click rose 9%. The split underneath that blended number is the part worth pinning up: branded keyword CPC rose 13% year over year against 3% for non-brand. This is Tinuiti’s own managed-client book, restricted to advertisers with consistent activity across the periods measured, so it’s an agency panel rather than a market census, and Tinuiti is a paid-media agency with a commercial interest in the story it tells about platform performance.
Put that next to Alphabet’s quarter and the shape of the problem is clear. The platform is healthy. The individual advertiser is paying more per click for fewer clicks, and paying the steepest increase on the terms where their own brand should give them leverage.
Where the Money Went Instead
Spend kept growing. It just went somewhere else. Advertiser spend on Google Shopping including Performance Max grew 19% year over year in Q2 2025 for Tinuiti clients, up from 8% growth in Q1, with Shopping ad clicks up 18% and average cost per click up only 1%, as summarized August 7, 2025. Among advertisers running both formats, Performance Max accounted for 59% of combined ad spend, up from 53% the previous quarter. Same caveat as above: this is Tinuiti’s own managed-account panel, a commercial agency reporting on its own clients, reflecting accounts with broadly consistent strategy quarter over quarter, so it may not generalize to your account.
Text ads got more expensive and less productive. Money flowed into the automated formats, where clicks were still growing and cost per click was nearly flat. That’s a rational move, and it’s also how a lot of accounts sleepwalked into giving up the query-level reporting they’d relied on for a decade.
How Ads Actually Behave Inside AI Overviews
What Shipped, Where, and When
At Google Marketing Live on May 21, 2025, Google said that “starting today” desktop users in the US would begin seeing Search and Shopping ads embedded inside AI Overviews, with expansion to select countries on mobile and desktop later in the year, according to Search Engine Land’s coverage. The scope is narrow and worth stating precisely: US desktop at launch, with the wider rollout promised only for later in the year, to select countries on mobile and desktop, focused on English-language queries, and no firm date attached to any of it. This isn’t a global rollout. Ads had already been appearing under a “Sponsored” heading beneath AI Overview responses since the previous October, per earlier Search Engine Land reporting, so the change was placement inside the summary rather than the arrival of ads near it.
The Placement Rule That Should Change Your Match Types
This is the most actionable product detail available, and it’s easy to miss. Google Ads Liaison Ginny Marvin clarified that a given ad can appear either above or below an AI Overview, or inside it, but not both at once, and that only broad match keywords are eligible for placement inside the AI Overview. Exact and broad match can both trigger above or below, with exact match prioritized in the auction when both are eligible, as reported May 29, 2025. That’s a mechanical description as Google’s Ads Liaison gave it in May 2025, and it’s subject to change.
If your account is disciplined, tightly themed, and built on exact match, which is what a decade of good practice taught, you have structurally excluded yourself from the placement inside the summary. That may well be the right trade, since exact match gets auction priority in the slots above and below, and the slot above the summary is the highest position on the page. But it should be a decision you make on purpose rather than an accident of your legacy account structure, and if the promised expansion to mobile lands, the choice gets more expensive to leave on autopilot, because mobile is where the fold argument bites hardest. The honest framing is that nobody has published a credible measurement of ad click-through rate inside an AI Overview, so you’re choosing between placements with no performance data on one of them.
Ads in AI Mode Are Still a Test
AI Mode is a generally available product in the US. Ads inside it are not the same thing. In the same May 2025 announcement Google described itself as “testing ads in AI Mode,” with eligibility automatic for advertisers running Performance Max, Shopping and Search campaigns on broad match, including AI Max for Search. Testing, not general release. Back in March, Google had told Adweek only that it would “explore bringing ads” to AI Mode, informed by how ads performed in AI Overviews, and the practitioners quoted at the time, including Navah Hopkins and Melissa Mackey, predicted lower engagement and potentially higher CPCs on the theory that users could get a complete answer without clicking out, per Search Engine Land. That was expert speculation, not measured ad performance, and it should be read as such.
So the practical answer to “are my ads running in AI Mode” is that you may be automatically eligible without having opted into anything, and there’s no public performance data to tell you how that’s going. Treat it as an open question about your account rather than a settled feature.
Performance Max, AI Max, and the Visibility You Traded Away
What AI Max Actually Is
Google announced AI Max for Search campaigns on May 6, 2025: a bundle of broader search term matching, AI-generated customization of headlines and descriptions, and final URL expansion, rolling out to advertisers globally in beta. The open beta in the Google Ads interface began May 27, 2025, with full API support scheduled for API v21 in August, according to the Google Ads Developer Blog. By May 29 it was still appearing for only some advertisers, with Google saying the rollout was expected to complete in early Q3 and giving no global availability date, as Search Engine Land reported. That article puts it bluntly: no data had been given as to when it would roll out globally.
Beta, incompletely deployed, no committed date. That’s the state of the thing you’re being encouraged to switch on.
Google’s Numbers, and What They Leave Out
Google says advertisers activating AI Max in Search campaigns “will typically see 14% more conversions or conversion value at a similar CPA/ROAS,” rising to 27% for campaigns still mostly using exact and phrase keywords, in the announcement post. Both figures are footnoted to “Google internal data, 2025,” not independently audited, and the 27% applies only to non-Retail advertisers drawing more than 70% of conversions or conversion value from exact or phrase match, which is a narrow qualifying segment rather than a typical account. Search Engine Land’s coverage of the same announcement adds that Google’s initial test results skewed toward “large household brands,” and flags the results as preliminary.
A vendor-reported lift, from vendor-selected accounts, skewed toward advertisers with brand equity you probably don’t have. That’s not a reason to refuse the test. It’s a reason not to plan your quarter around 14%.
What Reporting You Got Back
Google did give visibility back through 2025, in pieces. On January 23 it announced campaign-level negative keywords for Performance Max, asset-group segmentation, and a source column showing whether a query came from keywordless targeting or an added search theme, with phased rollout language. Search Engine Land covered the same update and quoted Google framing it as answering “a repetitive request” from advertisers for transparency, noting the gap Google was conceding. On April 30 Google announced channel-level reporting for Performance Max, as an open beta starting “in a few weeks”. That beta began rolling out May 30, and Search Engine Land cautioned that “full availability and functionality may vary” and that “some advertisers may find gaps in reporting or data accuracy” during the rollout, in its coverage. Then on July 2, Google let advertisers segment the Keywords and Search Terms report by match type, with AI Max as its own value, which Search Engine Land framed as only partially opening a reporting black box.
Line those up and the pattern is consistent. A channel breakdown, a match-type segment, a query-source label, a usefulness indicator, campaign-level negatives. Every one is category-level or channel-level, and not one returns what you actually lost: the list of specific queries that produced your conversions. You can see that AI Max matched something. You still can’t see what.
What a Small Team Should Actually Turn On
No study supports the following. It’s reasoning about a beta product, and you should treat it as such.
Run AI Max as a bounded test rather than an account-wide switch: pick campaigns where you can tolerate the variance and where you already know the baseline well enough to notice a change. Add campaign-level negatives to Performance Max before you increase its budget, not after, since the negatives are the only steering you have. Check the match-type segment weekly rather than monthly while anything is in beta, because beta behavior changes underneath you and a monthly cadence will show you the aftermath instead of the shift. And keep at least one campaign structured the old way, on exact match with tight themes, purely as a control. If everything in your account is automated, you’ve lost the ability to tell whether automation is helping.
Defending Brand Terms When Organic Can’t Defend Itself
Brand Is the Exception in the Data, With One Loud Asterisk
Brand behaves differently from everything else here, and two datasets point the same way. Amsive found branded click-through rate rose 18.68% when a summary appeared and that only 4.79% of branded queries triggered one, from an SEO agency with a commercial interest in the topic. Adthena showed no AI Overviews on Financial Services brand searches at all, from that same five-day snapshot of 25 enterprise brands run by a commercial vendor. Then Healthcare, in the same Adthena analysis, where brand searches returned a summary 39.6% of the time. So the accurate version of the rule is narrower than the one people repeat: brand terms were mostly quiet in most measured verticals, and conspicuously not in one. Check yours rather than inheriting the generalization.
Brand Defense Got More Expensive Anyway
Whatever your exposure, the cost moved against you. Tinuiti’s Q2 2025 data put branded keyword CPC up 13% year over year against 3% for non-brand, from the agency’s own managed-client panel of advertisers with consistent activity across the periods compared, which is not a market-wide census. Your cheapest inventory inflated four times faster than your expensive inventory.
How to Decide, Without a Study to Lean On
No study we could find tests brand bidding against AI Overviews. What follows is reasoning, not a finding.
The old argument against bidding on your own brand was that you were paying for a click you’d have gotten free from the organic listing directly beneath. That argument weakens as the organic listing sits lower, in proportion to how often your category triggers a summary. It doesn’t vanish: if your brand queries almost never return an AI Overview and your organic listing still sits at the top of a conventional page, the original logic mostly holds.
So make it an actual decision. Search your brand terms on a clean browser, note whether a summary appears, where your organic listing lands when it does, and who else is bidding. Run the brand campaign against a holdout if you can spare the traffic, which is the only way to learn what those clicks were worth. Then price the defense against what you learned rather than a rule of thumb from 2019. What’s worth avoiding is inertia in either direction: bidding on brand because you always have, or refusing because you read once that it’s wasteful.
Build an AI Overview Exposure Map
The Exercise
Nobody measured this workflow. It’s a practice recommendation, and it’s tedious rather than clever.
Pull your top spending queries, as many as you can stand to check by hand, weighted by spend rather than volume. For each one, run the search in a clean browser and record whether a summary appears. It is the paid-side cousin of the organic exercise in our AI search visibility audit. Tag the queries in a spreadsheet with a simple yes or no, then join that tag back to your spend and conversion data and split every report you care about on it.
You now have two accounts inside your account: the part exposed to AI Overviews and the part that isn’t. Almost every question in this article gets easier to answer once you can see that split, and every recommendation below depends on it.
What the Map Tells You to Do
The classification logic is the three patterns established above: informational queries carry most of the exposure, category matters more than tactics, and non-branded terms carry more risk than branded ones in most verticals. Each of those came with its own caveats and vendor interests, which are worth rereading before you lean on any of them.
The recommendations that follow from the map are reasoning, not measurement. Where exposure is high and intent is informational, expect the organic click to keep degrading and decide whether you want to buy that traffic at all, since informational clicks were never your best converters. Where exposure is low and intent is transactional, which for most advertisers is where the money already sits, very little needs to change and you should resist being talked into changing it. Where exposure is high on commercial terms, the genuinely uncomfortable quadrant, concentrate your attention, your negatives, and your testing budget.
Measuring When the Click Isn’t the Event
Why Last-Click Reporting Degrades First
Two things happened at once, and they compound. Fewer clickable events exist, since 26% of Pew’s AI summary visits ended the session entirely against 16% without a summary, from roughly 900 US adults in March 2025 browsing data covering Google only. And the events that do exist carry less identifying detail, since the match-type segmentation Google added in July 2025 tells you the category a match came from, not the query, which Search Engine Land framed as only partially opening the reporting black box.
A last-click model needs both a click and a knowable source. Both got scarcer in the same year. Nothing you do to your attribution settings fixes that, because the settings aren’t what broke.
Incrementality and Holdouts
No study connects AI Overviews to incrementality testing in paid search. What follows is standard practice, not a finding.
The substitute for attribution isn’t better attribution. It’s a test that produces a counterfactual. Geo holdouts are the most accessible version for a small team: pause or reduce a campaign in a set of comparable markets, leave it running in others, and compare total conversions rather than platform-reported ones. Time-based pause tests are cruder and confounded by seasonality, but they’re better than nothing and they cost nothing. Neither requires software you don’t have, and both answer the question your reporting can no longer answer, which is what would have happened anyway.
The discipline is picking the holdout before you need the answer. A test you design after the quarterly number disappoints will be shaped by the disappointment.
A Reporting Set That Survives This
Reasoning, not measurement. Report impression share on your priority query set rather than click volume, since impression share still describes the thing you’re buying. Report blended cost per acquisition across the whole paid program alongside the platform’s number, and show them side by side rather than picking one. Split brand and non-brand in every view, because the two are moving in opposite directions and averaging them hides both. Use the Performance Max channel breakdown as directional only, given the source’s own warning about gaps in reporting and data accuracy during rollout. And carry the match-type segment for anything running AI Max.
The organic side of this problem has the same shape and we wrote it up separately in our guide to measuring content performance when the click disappears. If you own both sides, read them together, because the worst outcome is a paid report and an organic report that quietly disagree about the same quarter.
What Not to Measure
Reasoning, with one sourced reason. Don’t try to infer AI Overview click behavior from Search Console. Ahrefs, which built a 300,000-keyword study on that data, states there is still no way to disambiguate AI Overview clicks and impressions from the rest of Search Console, and characterizes its own 34.5% figure as a comparative model rather than a direct measurement, from a vendor that sells SEO tooling. If the company that did the work says the data can’t be separated, your Monday morning export can’t separate it either.
Also resist reporting a conversion-rate comparison between traffic from AI surfaces and traffic from conventional results. No credible dated source measured it. Anyone quoting you a number for it is selling something, and the honest answer to that question is that it hasn’t been established.
Where Paid and Answer Engine Optimization Meet
No statistic supports this section. It’s an argument about where your two budgets should point.
If summaries mostly appear on informational queries and your ads mostly compete on transactional ones, your content problem and your paid problem sit at different points in the same funnel, and treating them as one produces bad decisions in both. Moving budget from content to paid because organic traffic fell doesn’t buy back that traffic, since the queries that lost clicks are largely not the queries you’d bid on.
The organic-side response is answer engine optimization, or AEO: the practice of structuring content to be cited inside generated answers rather than merely ranked beneath them. Our guide to answer engine optimization has the full version, and there’s a broader overview of how search and AI-driven answers now work together if you need wider context. The boundary worth stating here: none of that is a ranking switch. Structured data, a fresh date, or a file listing your pages for language models are not levers that make Google cite you, whatever a vendor tells you this quarter. The thing worth investing in is content that answers a real question well enough to be worth quoting, which is an argument about craft rather than a measured lever.
The paid corollary is simpler. Your ads can hold the top of a page your organic listing no longer reaches. Use that while you segment, and don’t mistake it for a fix to the organic problem.
A 30-Day Plan for a Two-Person Team
Reasoning and sequencing, not a studied protocol. Every item is doable without new software.
Week 1. Build the exposure map on your top spending queries. Split brand and non-brand in every report. Search your brand terms manually and record what you see, including who else is bidding.
Week 2. Add campaign-level negatives to Performance Max before touching its budget. Pull the channel breakdown and read it as direction rather than truth. Compare your branded CPC trend against non-brand over four quarters and see whether the pattern in the Tinuiti data shows up in your account.
Week 3. Start one bounded AI Max test on campaigns whose baseline you know cold, and check the match-type segment weekly. Leave at least one exact-match campaign untouched as a control.
Week 4. Design a holdout and start it. Pick the markets, the duration, and what result would change your mind, all before you see data. Then set next quarter’s reporting template: impression share, blended cost per acquisition, brand and non-brand split, and a named list of what you can’t measure.
Our take on the AI marketing stack for lean teams argues most teams need fewer tools than they think, and this is a good example: everything above runs on a spreadsheet and the interfaces you already pay for.
Questions Paid Teams Keep Asking
Do AI Overviews reduce clicks on my ads, or only on organic results?
The credible measurement is of organic link clicks, not ad clicks. Pew found traditional result links were clicked on 8% of visits where an AI summary appeared against 15% without one, from roughly 900 US adults on a March 2025 browsing panel covering Google only, which Pew says it can’t extend to other search engines. Nothing published measures ad click-through rate inside or beside an AI Overview. The only public statement on the ad side is Google’s own, from Chief Business Officer Philipp Schindler, that AI Overviews monetize “at approximately the same rate” as before, on the Q2 2025 earnings call, a qualitative characterization to investors rather than a disclosed rate.
Should I move budget from SEO to PPC because of AI Overviews?
Probably not the way the question implies. The organic damage concentrates on non-branded informational content, which Amsive measured at a 19.98% click-through decline against an 18.68% gain on branded terms, from an SEO agency’s 700,000-keyword analysis with the commercial interest that implies. Those informational queries are largely not the ones you’d bid on: Semrush found transactional queries made up under 3% of desktop AI Overview results, from data collected in September 2024, before Google permitted ads in AI Overviews, published by a commercial SEO vendor. Shifting budget doesn’t recover that traffic, because you’d be buying different queries.
Are my ads showing inside AI Overviews already?
Possibly, if you’re in the US, on desktop, in English, and running eligible campaign types, since Google began placing Search and Shopping ads inside AI Overviews for US desktop users on May 21, 2025, with expansion to select countries promised later in the year and no firm date, per Search Engine Land. One detail decides it for many accounts: only broad match keywords are eligible for the slot inside the summary, and an ad can appear either inside it or above and below it, never both, as Google’s Ads Liaison clarified in May 2025. A tightly built exact-match account is structurally excluded from the inside placement.
Is AI Max worth turning on?
Worth testing, not worth adopting wholesale. Google reports advertisers “will typically see 14% more conversions or conversion value at a similar CPA/ROAS,” rising to 27% for campaigns mostly using exact and phrase keywords, in its announcement post, but both figures are footnoted to “Google internal data, 2025” rather than independent audit, and the 27% applies only to non-Retail advertisers drawing more than 70% of conversions or conversion value from exact or phrase match. Search Engine Land adds that initial results skewed toward “large household brands” and flags them as preliminary, in its coverage. It also remained a beta reaching advertisers unevenly with no global availability date, as of late May 2025.
Why is my cost per click rising while my click volume falls?
That pattern showed up across a large agency book in Q2 2025: Google text ad clicks down 3% year over year for the second straight quarter, spend up 5%, and blended cost per click up 9%, with branded CPC up 13% against 3% for non-brand, from Tinuiti’s own managed-client panel of advertisers with consistent activity across the compared periods, an agency book rather than a market census. The usual explanation is competition concentrating on a smaller pool of clickable inventory. That’s plausible and unmeasured, so check the pattern in your own account first.
Can I still see which search terms triggered my Performance Max conversions?
Partially, and less than you’d want. Google added campaign-level negative keywords, asset-group segmentation, and a source column showing whether a query came from keywordless targeting or your own search themes, announced January 23, 2025 with phased rollout. Channel-level reporting followed, beginning its beta rollout May 30, 2025, with Search Engine Land noting the feature was beta and that “some advertisers may find gaps in reporting or data accuracy” while Google tuned it. Those are category and channel-level views, and they don’t restore the query-level list a keyword-based Search campaign gives you.
How do I prove paid search is working if last-click reporting is degrading?
No study answers this one, so treat what follows as standard practice rather than a finding. Use tests that produce a counterfactual: geo holdouts where you pause or reduce spend in comparable markets and compare total conversions, blended cost per acquisition alongside the platform’s number, and a brand versus non-brand split in every view. The reason you need them is measurable: Pew found 26% of visits with an AI summary ended with no further clicks anywhere against 16% of traditional-results visits, from roughly 900 US adults on March 2025 browsing data covering Google only. No attribution setting recovers an event that never happened.
Is Google’s claim that organic clicks are stable credible?
Report it accurately and weight it accordingly. Google’s Search blog, over the signature of Liz Reid, VP and Head of Google Search, stated that “total organic click volume from Google Search to websites has been relatively stable year-over-year” and that average click quality has risen, in a post published August 6, 2025. That post carries no percentages, no baseline, and no methodology, it defines a “quality click” using Google’s own proxy of whether a user quickly returns to search rather than anything tied to conversions, and it is Google measuring its own effect on sites it competes with for attention. The absence of numbers is itself informative. Your own account data is the thing to trust.
Where This Leaves a Paid Team
The page got taller and your ads stayed on top of it. That’s the whole advantage, and it’s a real one, but it only pays off if you know which of your queries the change actually touches. Most accounts don’t, which is why the exposure map is the first thing on the list and everything else is downstream of it.
The rest is discipline about evidence. Google’s numbers about your clicks come without methodology while its numbers about its own revenue come with figures attached, and you should read those two differently. Vendor studies point in a consistent direction and every one of them has a commercial stake in the direction they point. Your own account, split by brand and by exposure and tested against a holdout, is better evidence than any of it.
If you want a second set of eyes on how your paid program is holding up as the results page keeps changing, that’s what our paid advertising and AI search work covers. Either way, run the exposure map first. It costs an afternoon and it changes what every other number in your account means.