Most 2026 budget conversations start in the wrong place. Someone finds a benchmark, multiplies it by revenue, and splits the result across four channels. By March the money is committed, three of the four channels are underfunded, and nobody can say which one produced the two deals that closed.
The arithmetic is fine. The trouble is that a percentage split answers a question nobody asked. When pipeline is the goal, the useful question is what has to work first, and what only pays back once that’s working.
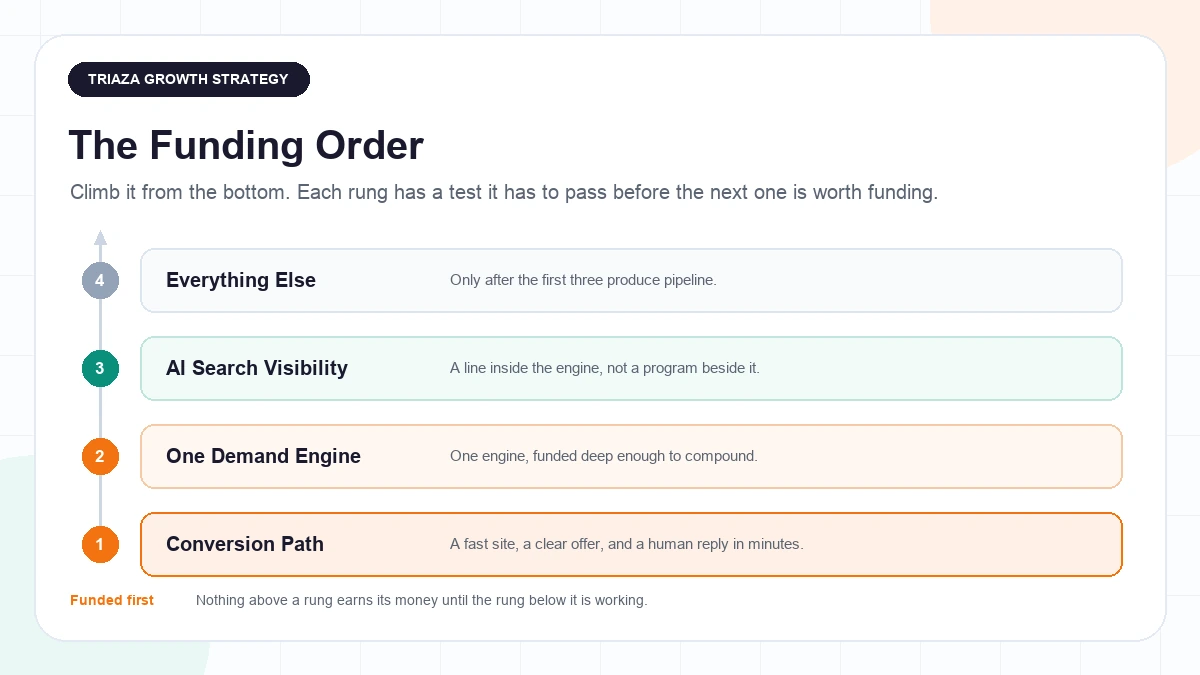
Fund the conversion path first: a fast site, a clear offer, and a lead handoff that answers in minutes. Then fund one demand engine deep enough to compound, with AI search visibility as a line inside it, not beside it. Cut the tools you aren’t using. Percentage-of-revenue benchmarks come last, if at all.
Here’s the reasoning behind that order, what the available benchmarks actually say once you read their fine print, and how to sequence a real budget you can defend to a board.
Why the 2026 Budget Conversation Feels Harder Than the Headlines
The funding headlines look fine. KPMG Private Enterprise’s Venture Pulse for Q3 2025, published October 23, 2025, put global venture investment at $120.7 billion across 7,579 deals, up from roughly $112 billion the previous quarter and the fourth consecutive quarter of growth. Eight of the ten largest global deals went to US companies, including a $13 billion raise by Anthropic and a $10 billion round by xAI. KPMG’s own framing is that AI is the defining theme of the quarter and that AI-focused startups secured meaningful growth capital, with softer language about companies without AI offerings drawing relatively less funding attention. That’s a market-tracking report built on proprietary deal data rather than a survey, so there’s no sample size to weigh it against.
Crunchbase’s own Q3 recap, published October 29, 2025, counted $97 billion globally for the quarter, with AI companies capturing $45 billion of it, or 46%. Rounds of $100 million or more made up roughly 60% of global and 70% of US venture capital so far in 2025, a year-to-date figure with the year not yet finished, and Crunchbase noted that seed-stage deal counts have shown a steady downward trend in recent quarters even while total seed dollars stayed relatively steady. Those figures come from Crunchbase’s proprietary dataset. The two trackers count different things using different methodologies, and the totals aren’t meant to reconcile, so read them as two views of the same shape rather than as a disagreement to resolve.
The shape is what matters here. Money is flowing, and it’s flowing into a narrow band of very large rounds. Our read, not something either report says: if your company isn’t in that band, the capital environment isn’t buying you patience. Your budget has to produce pipeline rather than buy time, and that constraint should drive the sequence, not a benchmark.
The Benchmark Trap: Percent of Revenue Is the Wrong Place to Start
Before the framework, it’s worth dismantling the instinct most founders start with, because it’s the single most confidently repeated piece of bad budgeting advice in marketing.
What the Averages Actually Say
The CMO Survey’s 34th edition, published in spring 2025 by Duke’s Fuqua School of Business with Deloitte and the American Marketing Association, reported marketing budgets at 9.4% of company revenue and 11.4% of overall company budget in early 2025, up from 7.7% and 10.1% the previous fall. Those figures come from 281 marketing leaders, 99% of them at VP level or above, at for-profit US companies, and they’re self-reported estimates rather than audited financials.
Seven weeks later, Gartner’s 2025 CMO Spend Survey, published May 12, 2025, reported marketing budgets flat at 7.7% of overall company revenue. That survey covered 402 CMOs and marketing leaders across North America, the UK and Europe, fielded February to March 2025, and the vast majority of respondents reported annual revenue above $1 billion. Gartner also noted that half of respondents reported budgets at 6% of revenue or less, which tells you how much a small number of large spenders pull the average around.
Two credible surveys, published weeks apart, produce different headline numbers because they surveyed different companies. That alone should end the search for “the” benchmark. Neither one surveyed a company that looks like yours.
Small Companies Spend a Much Bigger Share, and That Is Normal
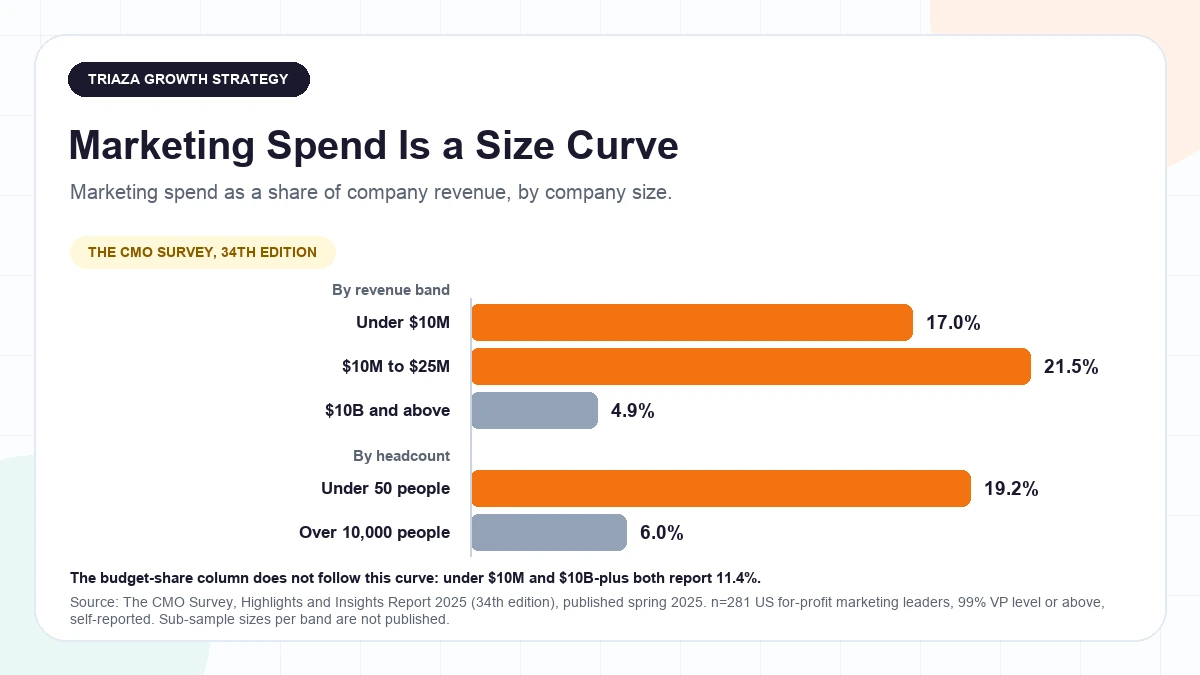
Break the same survey out by size and the headline number stops meaning anything. The CMO Survey’s 34th edition report shows companies under $10 million in revenue spending 17.0% of revenue on marketing against 4.9% for companies above $10 billion, and companies under 50 employees spending 19.2% of revenue against 6.0% for companies over 10,000. The sample is 281 respondents from 2,047 invited, a 13.7% response rate, 99% at VP level or higher, US for-profit only, skewing business-to-business at 58.4%. The report doesn’t publish sub-sample sizes for individual bands, so a narrow band like $10 million to $25 million rests on some small fraction of those 281 and is directional at best.
One thing that curve does not do is hold up on the budget-share column. There, companies under $10 million and companies over $10 billion both report 11.4%, and the $10 million to $25 million band reports the highest share of any group at 15.9%. The clean size relationship exists on the revenue-share column and not on the budget-share one, which is worth knowing before you quote either number at a board meeting.
The practical takeaway is that if you’re small and spending a share of revenue that feels alarming next to a published average, you may simply be small. That’s not permission to overspend, but it is a reason to stop treating the average as a ceiling you’ve breached.
B2B Numbers Are Lower Than B2C Numbers, and Copying Across Is a Mistake
The same report splits by business model: business-to-business product companies reported 7.4% of budget and 6.4% of revenue, business-to-business services 6.7% and 9.0%, business-to-consumer product 21.5% and 15.5%, and business-to-consumer services 11.7% and 6.0%. The survey was fielded January 21 to February 12, 2025, and while the overall sample is 281, those four cells are means drawn from sub-samples of roughly 45 to 100 respondents each, all self-reported. Treat them as directional.
That spread is why most circulating “marketing should be X% of revenue” advice is useless to a technical B2B company. It’s averaged across business models with different sales cycles, different deal sizes, and different relationships between spend and revenue. A consumer product company buying attention at volume and a B2B company working eight-month cycles are not doing the same job with the same money.
Marketers’ Own Spending Forecasts Have a Track Record
Here’s a specific miss worth pinning to the wall. Tracking its own social media spending forecasts on page 28, the report finds the predictions didn’t come true: “In the Spring of 2024, marketers predicted spending would reach 12.2% in the next year, but the actual level remains lower at 11.3%.” The year before was worse. Leaders said they would spend 20.3% within a year, and the level fell to 11% instead. Those percentages are social media’s share of the marketing budget rather than the budget itself, self-reported by the same 281 senior marketers.
That’s one line item and not the whole budget, so don’t stretch it further than it goes. What it does show is that the forward-looking numbers in these surveys are what a room full of VPs expected to happen, and that on the one forecast this report checks against its own later results, the expectation missed twice running. Build your plan on somebody else’s forecast and you’ve inherited their optimism without their context.
Start With the Constraint, Not the Allocation
The alternative to copying a percentage is to set a constraint first: decide what a month of marketing spend has to return, and by when. That single decision determines both how much you can spend and how patient you can afford to be, and everything downstream follows from it.
The Number That Sets Your Ceiling
Customer acquisition cost payback is the number worth anchoring to, because it converts marketing spend into a survivable-or-not answer. As Development Corporate reported on November 11, 2025, citing High Alpha’s 2025 SaaS Benchmarks Report, median CAC payback for B2B SaaS companies between $1 million and $5 million in annual recurring revenue was 8 months, with the top quartile at 5 months and an underperforming cohort above 14 months. Development Corporate’s own guidance is to treat anything beyond 12 months as a warning signal. That’s specific to the $1 million to $5 million ARR segment rather than all B2B SaaS, it comes to us through secondary coverage rather than the primary report, and the underlying High Alpha data covers more than 800 SaaS companies gathered with over 40 venture and platform partners across Q2 2024 to Q2 2025.
Kyle Poyar’s recap of the same report, published November 12, 2025, frames CAC payback and net revenue retention as the two strongest predictors of profitable growth. That survey drew more than 800 companies, fielded August to September 2025, 69% US-based, with the typical respondent between $5 million and $20 million in ARR across a range spanning $0 to $50 million and up. Our own caution rather than the source’s: this is a self-selected population of companies that opted into a benchmarks program, and the recap doesn’t report a response rate or a margin of error.
Turning a payback target into a monthly ceiling is arithmetic you can do on a napkin, and it’s our method rather than anything published. Take your average contract value, multiply by gross margin to get the actual cash a customer returns, then divide by your target payback in months to get what a customer can afford to cost per month of payback. Work backward through your close rate and you have a defensible ceiling on what a qualified opportunity is worth, and therefore on what a month of marketing can cost. No source we found provides a correct ceiling, because it’s a function of your numbers rather than an industry constant.
Why the Constraint Comes Before the Channel Mix
Once you have that ceiling, channel selection stops being a taste question. A channel that can’t clear your payback window isn’t a cheap channel with a long horizon. It’s a channel you can’t afford yet, and the distinction matters because “long horizon” is how expensive bets get approved.
The honest exception: a company with real runway and a strategic reason to buy category position early can deliberately accept a longer payback. That’s a legitimate choice when it’s made on purpose, with a stated end date and a number that would end it. It’s a different thing entirely when it happens by drift, which is what usually happens. If you’re making that call, our marketing strategy work exists to make it explicit rather than accidental.
Tier One: Fund the Conversion Path Before You Fund a Channel
Every channel you fund multiplies whatever this tier produces. If the path from click to conversation leaks, more traffic buys you more leakage at a higher price. This is usually the cheapest line in the budget and almost never the first one funded.
Speed on the Route to the Form
The Deloitte Digital and fifty-five study commissioned by Google in 2020 found that a 0.1 second improvement in mobile load time was associated with an average 8% increase in retail conversion rate and 10% for travel, with retail visitors spending almost 10% more. That study looked at 37 selected brands across retail, travel, luxury and lead generation in Europe and the US over a four-week window covering more than 30 million mobile sessions. It was commissioned by Google, the brands weren’t a random sample, and no confidence intervals or significance tests are reported.
Read the fine print before you borrow the number. The lead-generation vertical in that study showed visitors viewing 7% more pages, not converting 8% more often. So the honest version is that speed measurably moves user behavior, and the specific conversion figures come from retail rather than from a B2B site with a demo form. What it does establish is that the effect shows up at a tenth of a second, which is far below the threshold most teams consider worth fixing.
For a startup, this is rarely a rebuild. It’s usually images, third-party scripts, and whatever the tag manager accumulated. The startup website launch checklist covers the build-time version of this, and our website work covers it when the route to the form is the thing that’s broken.
The Reply Clock
The most valuable unglamorous line in a startup budget is whatever gets an inbound lead a human reply quickly. The evidence people quote for this is genuinely old and genuinely compromised, and it’s still directionally useful if you handle it honestly.
The InsideSales.com and MIT study by Dr. James Oldroyd, first presented in October 2007, found contact odds roughly 100 times higher at 5 minutes after lead creation than at 30 minutes, and qualification odds 21 times higher over the same window, based on more than 15,000 web-generated leads and over 100,000 call attempts across six B2B companies. Four caveats travel with those numbers and none is optional: Oldroyd stresses the patterns emerge only when data from several companies is pooled, so it isn’t reliable at a single-company level; the call data comes entirely from InsideSales.com’s own platform, and the company sold a callback dialer built on this exact finding; a companion Kellogg survey of 495 marketers found no statistically significant answer to the timing question at all; and it’s from 2007.
Used with all four caveats attached, it’s still the best available evidence that the curve is steep early, and steepness is the only part you need. For a small team the fix is a routing and staffing decision, not a software purchase: name one person per day, pick a response window you’ll actually hit, and measure the spread instead of the average. We’d sooner see a team commit to one business hour and hit it than promise five minutes, miss, and stop measuring. That’s operating judgment, not a study finding. The deep version of this argument is in where startup leads disappear between marketing and sales, and it’s what our sales and marketing alignment work is for.
The Offer, Not the Form
This subsection carries no statistic, by design, because we couldn’t source one worth citing.
What the visitor is being asked to do matters more than how the form looks. “Book a demo” is a large ask that assumes the reader has already decided you’re a candidate. Most early-stage sites make that ask to people who arrived from a search result forty seconds ago, then conclude the traffic is bad. A smaller ask that produces a real conversation beats a bigger ask that produces nothing, and the way to find out which is which is to look at what your last twenty inbound conversations actually started with.
Use the CRM You Are Already Paying For
Per Gartner’s 2022 Martech Survey, reported by Chief Marketer in October 2022, marketers said they were using 42% of their martech stack’s available capabilities, down from 58% in Gartner’s 2019 survey. That’s 324 marketing leaders surveyed in May and June 2022, self-reported estimates reaching us through secondary coverage rather than audited usage data, with no respondent industry or geography breakdown published. It’s also from 2022, so read it as a persistent pattern rather than a current measurement.
The pattern is what’s useful. In most startup budgets the cheapest available capability increase is turning on something already licensed: lead routing, response-time reporting, a working lifecycle stage, deduplication. None of that is a new line item, and all of it makes tier one work.
Tier Two: Fund One Demand Engine Deep Enough to Compound
Here’s the part you can reasonably disagree with. Our position is that a small team should fund one demand engine deep rather than hedge across two. Plenty of experienced operators run paid and organic in parallel from day one and do fine. We’d still argue for depth.
Why Depth Beats Breadth on a Small Team
The Content Marketing Institute and MarketingProfs B2B benchmarks report published October 9, 2024 found that 76% of B2B marketers have dedicated content marketing staff, and among those, 54% run teams of two to five people, while 24% have no dedicated content staff at all. Only 29% rated their content strategy extremely or very effective, against 58% who said moderately effective and 12% who said it wasn’t working. Those figures come from 980 B2B respondents out of 1,186 total global respondents, fielded June 25 to August 16, 2024, skewing North American, and the effectiveness ratings are self-reported perception rather than any external outcome measure.
The team-size number is the one that should shape your budget. A two-to-five-person team split across three channels is a two-to-five-person team producing three shallow programs. That’s our read rather than a finding in the report, but it’s consistent with the effectiveness numbers sitting where they do: most teams rate their own strategy as moderately effective, which is roughly what you’d expect from capacity spread thin.
The tradeoff is real and worth naming. Concentrating on one engine means that if you pick wrong, you find out later than you would have with two. The exception we’d make is a company whose sales motion genuinely requires both, where paid covers a category with existing demand while organic builds a category that doesn’t yet have a budget line. If that’s you, fund both and accept that each will move slower.
Choosing Organic as the Engine
Organic compounds and doesn’t stop when you stop paying, which is the entire argument for it. It also takes longer than anyone wants, and we’re not going to quote you a number for how long. Every “SEO takes N months” source we checked was either undated or untraceable to a real study, so treat timing as a range of experience rather than a finding, and tie your patience to the payback constraint you set earlier instead of to a generic six-month promise.
The same CMI research found that among the 63% of respondents who knew their content budget, 46% expected it to increase in 2025, 41% expected it to stay flat, and 8% expected a decrease, with the same 980-respondent B2B sample and mid-2024 fielding window. Read that as context on where peers were heading, not as a recommendation.
What makes organic affordable for a small team is a production system rather than heroics, which is what building an AI content system that doesn’t sound like AI covers, and honest measurement, which is what measuring content performance in a zero-click world covers. Our content marketing and SEO work is the same argument with someone doing it.
Choosing Paid as the Engine
Paid buys speed and, more usefully, a clean test of whether your offer works. It also stops the day you stop paying, and it’s getting more expensive.
On Alphabet’s Q3 2025 earnings call, held October 29, 2025, Chief Business Officer Philipp Schindler said paid clicks were up 7% year over year and cost per click was up 7% year over year. Schindler also noted the company doesn’t really manage to paid click and CPC targets, and that figure is an aggregate, company-wide Search number reflecting mix effects like query volume, geography and ad format rather than a controlled price change. Your own CPC trend in a narrow B2B category may look nothing like it.
The useful question isn’t which channel is cheaper, but which one you can still afford in month nine, after the initial budget enthusiasm has worn off and the board is asking about efficiency. Paid answers fastest and costs continuously. If paid is your engine, what happens to PPC when the results page shrinks is worth reading before you commit the year, and our paid advertising work covers the build.
Buyers Show Up With a Shortlist Already
Whichever engine you fund, its actual job may be earlier than you think. As Digital Commerce 360 reported on July 7, 2025, citing Forrester’s 2024 Buyers’ Journey Survey, 92% of B2B buyers begin the purchase process with at least one vendor already in mind, and 41% already have a single preferred vendor before formal evaluation begins. That’s secondary press coverage of Forrester’s proprietary research; the article doesn’t disclose the underlying sample size or methodology, and it’s self-reported buyer behavior.
If that’s roughly right, then a large share of what your demand engine buys is being on the list before anyone starts evaluating, which is a positioning problem as much as a spending one. Explaining a new category before buyers have a budget line is the version of that problem most technical startups actually have.
How Long to Commit Before You Judge It
Don’t set the review window by feel, and don’t set it at “six months” because that’s what people say. Set it against the payback constraint: if your target payback is 8 months, an engine that hasn’t produced a single opportunity by month four isn’t behind schedule, it’s failing, because the deals it hasn’t sourced yet still have to close and pay back inside the window. That’s arithmetic from your own constraint rather than a benchmark.
Tier Three: Fund AI Search Visibility as a Line Inside the Engine, Not a Separate Program
Answer engine optimization (AEO) is the work of being cited as a source inside AI-generated answers rather than ranking as a link beside them. It belongs in the 2026 budget. It does not belong as its own program with its own headcount, and the reason is that the work it requires is largely the work your demand engine already does.
What Changed on the Results Page
Analysis by Ahrefs, covered by Digital Content Next on May 6, 2025, found average click-through rate for pages ranking first fell from 7.3% in March 2024 to 2.6% in March 2025 on queries where an AI Overview appeared, a 34.5% relative decrease. That looked at 300,000 keywords, 150,000 triggering AI Overviews against a 150,000-keyword control, and was restricted to informational queries because 99.2% of AI-Overview-triggering keywords fall in that category. Google Search Console doesn’t separate AI Overview clicks from standard organic clicks, so the attribution is inferred from aggregate CTR shifts rather than directly measured, and Ahrefs framed the work as a challenge to Google’s position rather than a disproof of it.
That informational-query restriction matters more for a B2B reader than the headline number does. If your money keywords are commercial, this measurement doesn’t cover them, and you should be careful about assuming the same effect size applies.
Separately, Pew Research Center panel data reported by The Register on July 22, 2025 found users clicked a traditional search result on 8% of visits when an AI Overview appeared, against 15% when none did, and clicked a link inside the overview on just 1% of visits, with AI Overviews appearing on roughly one in five searches in the panel. That’s 900 US adults who voluntarily shared browsing activity, collected in March 2025, and it’s a correlational panel study rather than a controlled causal test or a representative measure of all web traffic. Google publicly disputed it, calling it a flawed methodology and skewed queryset not representative of Search traffic, and said it directs billions of clicks to websites daily. Both the panel caveat and Google’s rebuttal belong with the numbers wherever they get quoted. AI Overviews explained covers the mechanics in more depth.
The Surfaces Are Real and Already Global
This isn’t a pilot you’re budgeting ahead of. Google announced on October 7, 2025 that AI Mode had added more than 35 new languages and over 40 new countries and territories, bringing availability past 200 countries and territories, and stated that people ask questions in AI Mode nearly three times longer than in traditional search. That query-length figure is Google’s own self-reported usage claim, stated qualitatively with no breakdown by query type, region or methodology.
On the assistant side, ChatGPT passed an estimated 800 million weekly active users around September to October 2025, per TechAfrica News on October 7, 2025. That article describes the figure as an estimate and dates it approximately rather than citing a company announcement, so treat it as reported scale rather than a disclosed metric.
How Much of the Traffic Story Is Actually Measurable Yet
Not much, and pretending otherwise is how this line item gets oversold. Adobe Analytics reported on March 17, 2025 that traffic to US retail sites from generative AI sources grew 1,200% by February 2025 against a July 2024 baseline, roughly doubling every two months since September 2024, while the conversion gap between AI-referred traffic and other traffic narrowed from 43% in July 2024 to 9% across November 2024 to February 2025. That’s based on more than a trillion visits to US retail sites plus a survey of over 5,000 US respondents, “generative AI sources” means referral clicks from AI products rather than all AI-assisted research, and Adobe states plainly that the traffic remains modest compared to other channels such as paid search or email.
Two things follow, and both are our reasoning rather than Adobe’s. A percentage growth rate off a very small base is not by itself a budget justification. And this is US retail, not B2B, so any inference you draw for a technical B2B company is crossing a context gap you should say out loud. The narrowing conversion gap is the more interesting half anyway: it suggests this traffic started poor and got better, which is a reason to be present rather than a reason to reallocate.
We also want to be straight about what we can’t tell you. We found no dated survey showing that companies were actually moving budget into AI search visibility at this point, so we’re not going to imply your peers are doing it. The case for the line item rests on where the surfaces are and what happened to clicks, not on a peer trend.
What This Line Item Actually Buys
Mostly, it buys the same work your demand engine is already doing, aimed slightly differently: answers stated plainly enough to be quoted, structure a machine can parse, consistent naming so an entity resolves to you, and a measurement approach that doesn’t depend on a last click that increasingly doesn’t happen. Structuring content for AI citation and the AEO explainer cover the craft.
What it doesn’t buy is a switch. Nothing about schema markup, an llms.txt file, or a refreshed date on an old post is a ranking requirement or a lever that turns citations on. Schema makes meaning explicit for machines that already found your page, which is useful and is not the same claim. If you want to know where you currently stand before funding anything, an AI search visibility audit is the cheaper first step, and our AI search optimization work is the ongoing version.
Tier Four: What Gets Funded Once the First Three Work
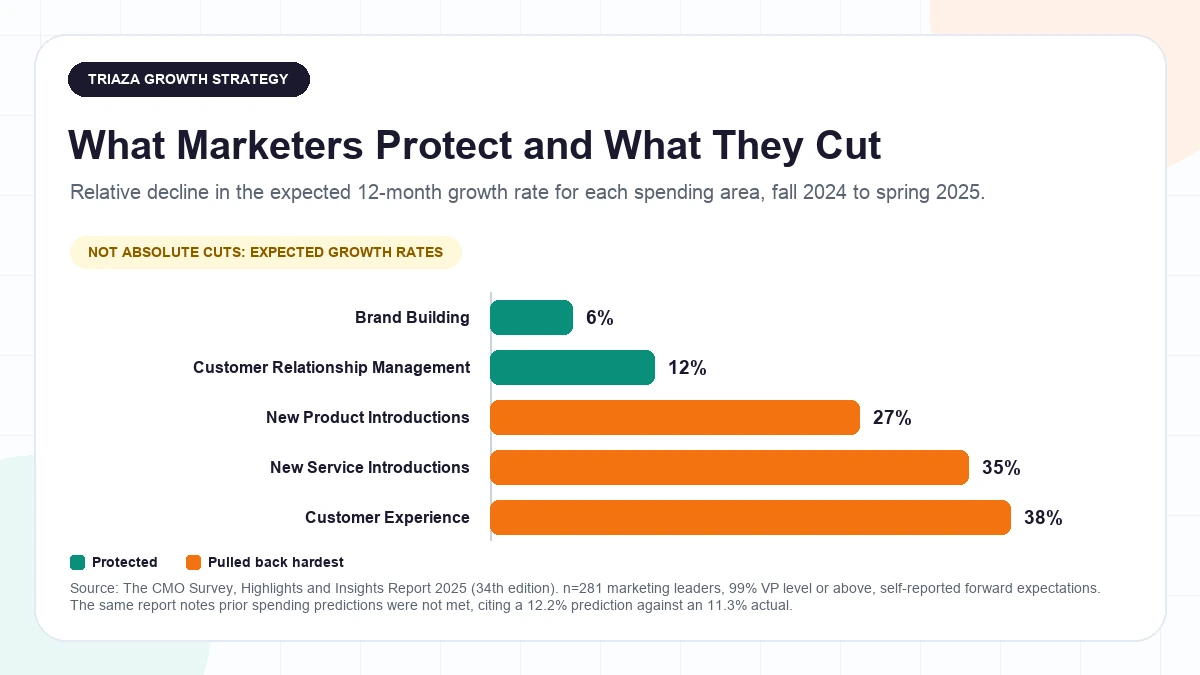
Tier four is the second channel, brand investment beyond the minimum, events, partner and community programs, and headcount ahead of demand. The promotion test is simple: tiers one through three are producing measurable pipeline inside your payback window. Until then these are bets funded from hope.
It’s worth seeing what larger marketing organizations do when growth expectations cool. The same CMO Survey report shows the relative change in expected 12-month growth rates between fall 2024 and spring 2025: customer relationship management down 12%, brand building down 6%, new product introductions down 27%, new service introductions down 35%, and customer experience down 38%. Those are declines in expected future growth rates rather than absolute budget cuts, they’re self-reported by 281 senior marketers, and the same report notes that marketers’ prior spending predictions were not met, quoting a 12.2% prediction against an 11.3% actual.
So the instinct at scale is to protect relationships and brand and to pull back on new introductions and experience work. Our sequence deliberately disagrees with part of that for a startup specifically. Customer experience for a large company usually means a program; for a five-person company it means whether an inbound lead gets answered, which is tier one and the least cuttable thing in the budget. Brand building for a large company protects an asset that already exists. For a company nobody has heard of, it’s mostly tier four. The survey describes what large organizations did. It doesn’t endorse the order, and we’re not claiming it does.
What to Cut, and What Not to Fund at All
The two items here with evidence behind them are tooling and agency spend. The rest is our judgment, and we’ll say which is which.
Tooling first, because it’s the easiest money in the budget. Gartner’s 2022 survey, reported by Chief Marketer, put martech capability utilization at 42%, down from 58% in 2019, from 324 self-reporting marketing leaders via secondary coverage. Whatever the exact figure is today, the direction has been consistent long enough to plan against: you’re paying for more than you use. Audit the stack against what actually got used in the last 90 days, and cancel on the basis of usage rather than intent. The AI marketing stack for lean teams covers what’s genuinely worth paying for at small scale, and the sales tooling roundup covers the layer underneath it.
On agencies, Gartner’s 2025 CMO Spend Survey reported 39% of CMOs planning to cut agency budgets and 22% saying generative AI had reduced their reliance on external agencies. That’s 402 respondents surveyed February to March 2025 across North America, the UK and Europe, with the vast majority above $1 billion in annual revenue, so it describes what enterprise marketing departments were doing and is not a startup sample. We’d read it as a reason to be specific about what outside help is for rather than as a reason to bring everything in-house.
The rest of the cut list is editorial judgment, offered as such:
- A second channel started before the first one clears its payback window.
- A rebrand before positioning is settled. If the words aren’t right, new colors won’t fix it, and a message blueprint is the cheaper order of operations.
- Sponsorships you can’t attribute and wouldn’t renew on evidence.
- Tooling bought to solve a process problem. The tool will implement the broken process faithfully.
- More content while the conversion path still leaks. You’re paying to send more people through a gap.
Sequencing a Real Budget: A Worked Example
What follows is an illustration built to show the order of operations, not a recommended allocation. No source we found supports any specific split, and the numbers below are inputs to the arithmetic rather than benchmarks.
Take a B2B company at roughly $1.5 million ARR with a small monthly marketing budget and a board asking for pipeline.
Month one goes almost entirely to tier one. Fix what’s slow on the route to the form. Rewrite the offer to match where visitors actually are. Name an owner per day for inbound and start measuring creation-to-first-human-touch as a distribution rather than an average. Turn on the routing and reporting you’re already licensed for. Almost none of this is a new invoice, which is the point: the first month’s spend is mostly attention.
Months two and three fund one engine. Pick it against the payback ceiling you calculated, not against preference. If your target payback is 8 months and you need opportunities inside the quarter, paid answers faster. If you’re building a category and the searches don’t exist yet, paid has nothing to buy and organic is the only engine that works. Commit properly to whichever you pick, and write down what would make you stop.
Month three onward, AEO rides inside that engine. It’s not a separate budget line, a separate hire, or a separate agency. It’s a set of requirements on the work already being produced.
Tier four stays unfunded until you can point at pipeline from tiers one through three inside your payback window. When someone proposes an event or a second channel, the answer isn’t no. It’s “show me the first three working.”
Reviewing the Budget Every 90 Days
Review on a schedule rather than on a feeling, and look at things in this order.
First, the conversion path. Is response time still where you set it, and has the distribution drifted? This degrades quietly and it’s the cheapest thing to fix.
Second, payback. Median CAC payback for the $1 million to $5 million ARR segment was 8 months in the High Alpha data reported by Development Corporate, with above 12 months flagged as a warning signal, self-reported by companies that opted into the benchmarks program and reaching us through secondary coverage. Your own number against your own target is what matters. If it’s drifting past your ceiling, that overrides the plan, and it’s the one number allowed to.
Third, the engine. Is it producing at the rate the commitment window assumed?
Fourth, and only fourth, the allocation. Measurement in a zero-click environment is its own problem, and measuring content performance in a zero-click world covers how to do it without pretending last-click still works.
Questions Founders Keep Asking About Marketing Budgets
What percentage of revenue should a startup spend on marketing? There isn’t a number, and the published averages don’t describe you. The CMO Survey’s 34th edition, published spring 2025 from 281 self-reported US marketing leaders at VP level or above, put marketing at 9.4% of revenue overall, but the full report shows companies under $10 million in revenue at 17.0% and companies under 50 employees at 19.2%, with no sub-sample sizes published per band. Gartner’s 2025 CMO Spend Survey, published May 12, 2025, reported 7.7% from 402 respondents whose vast majority exceed $1 billion in revenue, with half reporting 6% or less. Derive your number from CAC payback instead.
What should I fund first if I only have one line of budget? The conversion path. A 2020 Deloitte Digital and fifty-five study commissioned by Google, covering 37 selected brands with no confidence intervals reported, associated a 0.1 second mobile speed improvement with an 8% retail conversion increase, though its lead-generation result was page views rather than conversions. And the 2007 InsideSales.com and MIT study found contact odds about 100 times higher at 5 minutes than at 30 minutes, pooled across only six companies, using data from a vendor selling callback software, alongside a companion 495-marketer survey that found nothing statistically significant. Both are old and both are directional, and neither is a reason to skip fixing the path leads travel.
Should I fund SEO or paid ads first? It depends on your payback window, and we won’t pick for you. Paid is faster and gets more expensive: Alphabet’s Q3 2025 call on October 29, 2025 had Chief Business Officer Philipp Schindler report cost per click up 7% year over year, an aggregate company-wide Search figure reflecting mix effects rather than a controlled price change. Organic compounds and takes longer, and we’re not quoting a timeline because every source we checked was undated or untraceable. If your team is the typical size in the Content Marketing Institute’s October 2024 B2B benchmarks, where 54% of those with dedicated content staff run teams of two to five people among 980 self-reporting B2B respondents, pick one and fund it properly.
Do I need a separate budget line for AI search optimization? A line, yes. A separate program, no. AI Mode passed 200 countries and territories as Google announced on October 7, 2025, and Ahrefs analysis covered May 6, 2025 found first-position CTR falling from 7.3% to 2.6% on AI Overview queries across 300,000 keywords, restricted to informational queries and inferred from aggregate CTR shifts rather than directly measured. Meanwhile Adobe reported March 17, 2025 that generative AI referral traffic to US retail sites grew 1,200% between July 2024 and February 2025 while stating it remains modest next to paid search or email, which is US retail rather than B2B. The surfaces are real, the referral volume is small, and the work overlaps almost entirely with good content work. Fund it inside the engine.
How fast do we actually have to follow up on an inbound lead? Faster is better and the curve is steep early, but no independent benchmark exists. The 2007 InsideSales.com and MIT research found contact odds roughly 100 times higher at 5 minutes than at 30, and qualification odds 21 times higher, pooled across six B2B companies using data from a company selling response-speed software, with a companion Kellogg survey of 495 marketers finding no statistically significant answer. We recommend a one-business-hour target with a same-day backstop, because teams that promise five minutes miss it and stop measuring. That’s our judgment, not a study finding.
What is a reasonable CAC payback period for an early-stage B2B company? As Development Corporate reported November 11, 2025 citing High Alpha’s 2025 SaaS Benchmarks Report, median payback for $1 million to $5 million ARR B2B SaaS was 8 months, top quartile 5 months, and an underperforming cohort above 14 months, with over 12 months flagged as a warning. That’s one ARR segment, reaching us through secondary coverage of the primary report. Kyle Poyar’s recap, November 12, 2025, describes a sample of more than 800 companies fielded August to September 2025, 69% US, typically $5 million to $20 million ARR; our own caution is that these are companies that opted into a benchmarks program and no response rate or margin of error is reported.
What should I cut first when the budget gets cut? Unused software, then unattributable spend. Gartner’s 2022 martech survey of 324 marketing leaders, via Chief Marketer, found self-reported utilization at 42% of stack capabilities, down from 58% in 2019, through secondary coverage rather than audited data. On outside help, Gartner’s 2025 CMO Spend Survey found 39% of CMOs planning agency cuts and 22% citing generative AI as reducing agency reliance, from 402 respondents mostly above $1 billion in revenue, which is an enterprise pattern rather than a startup one. Cut the conversion path last. It’s the cheapest thing you own.
Where This Leaves Your 2026 Plan
You don’t need a benchmark. You need three numbers you can pull today: average contract value, gross margin, and the payback window you’re willing to defend in a board meeting. Every decision in this article sits downstream of those three.
The published averages will still be there in a year, and they’ll still describe companies that aren’t yours. What decides whether next year works is whether the conversion path holds and the engine clears its window.
If you’d rather build the sequence with someone than assemble it from articles, that’s what our AI strategy and growth roadmap work is for.